
|
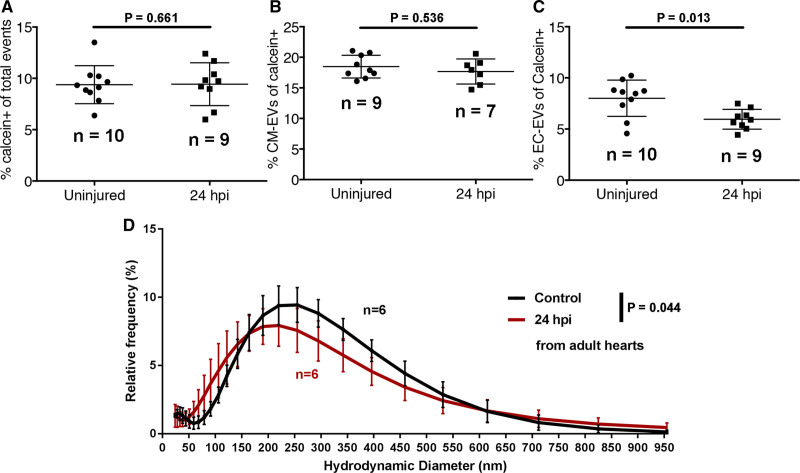
Figure 6.
Figure 6. A model of myocardial infarction (MI) induces dynamic changes in cardiovascular extracellular vesicles (EVs) from adult zebrafish. A–C, Quantification of the number of calcein+ (A), myl7(mCherry)+ (B), and kdrl(mCherry)+ EVs in uninjured and injured hearts at 24 hpi. D, Histogram of DLS analysis reveals a significant shift in the size of overall EVs at 24 hpi compared with uninjured hearts. Statistical analysis in A–C, 2-tailed Mann-Whitney U tests. Statistical analysis in D: a custom permutation test using total variation distance was used to test the null hypothesis that control and 24 hpi distributions were the same.