IMAGE

Fig. 1

ID
ZDB-IMAGE-210825-5
Source
Figures for Watchon et al., 2021
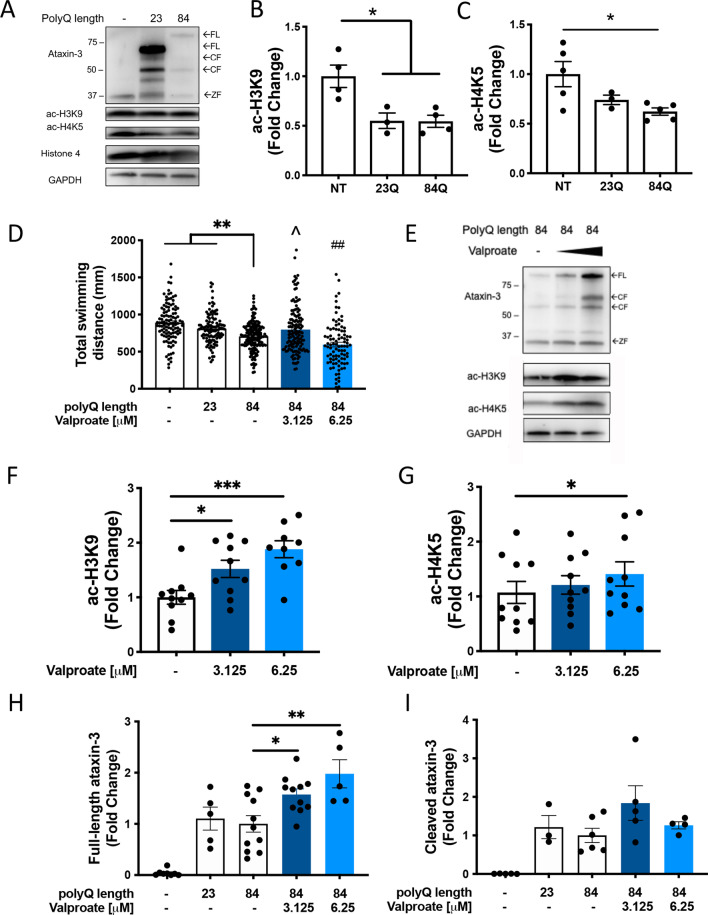
Image
Figure Caption

Fig. 1

Levels of acetylated histones 3 and 4 are decreased in MJD zebrafish and sodium valproate increases levels of acetylated histones and locomotion in transgenic MJD zebrafish. A Immunoblots of 6-day-old transgenic MJD zebrafish expressed human ataxin-3 with full-length (FL) ataxin-3, cleaved (CF) ataxin-3 and endogenous zebrafish ataxin-3 (ZF). Transgenic MJD zebrafish also have decreased levels of acetylated histone 3 (ac-H3K9) and 4 (ac-H4K5) with no differences in histone 4. B Quantification of ac-H3K9 showed wild-type and mutant ataxin-3 larvae with significantly lower levels of ac-H3K9 compared to the non-transgenic control (*p < 0.022, n = 3–5). C Densitometric analysis of the amount of ac-H4K5 revealed a significant decrease in ac-H4K5 in the mutant ataxin-3 zebrafish compared to the non-transgenic control (*p = 0.026, n = 3–5). D Treatment of MJD zebrafish with low-dose sodium valproate (valproate; 3.125 µM) increased the distance travelled during movement tracking to control treated EGFP-Ataxin-3 84Q (^p = 0.019, n = 93–161). By contrast, high dose valproate (6.25 µM) decreased the distance travelled compared to EGFP-Ataxin-3 84Q, ##; p = 0.008. E Western blotting of valproate treated EGFP-Ataxin-3 84Q larvae resulted in increased levels of full-length human ataxin-3, ac-H4K5 and ac-H3K9. F Quantification of ac-H3K9 levels revealed valproate treatment increased ac-H3K9 in a dose dependent manner (*p = 0.004 and ***p = 0.003; n = 9). G Quantification of ac-H4K5 showed an increase with 6.25 µM valproate treatment (*p = 0.043, n = 10). H Quantification of human FL ataxin-3 showed significantly increased levels with both concentrations of valproate treatment compared to vehicle treated mutant ataxin-3 fish (*p = 0.0495, **p = 0.002, n = 5–11). I Quantification of human CF ataxin-3 relative to loading control showed no changes after treatment with sodium valproate (n = 3–6). Data represent mean ± SEM. Statistical analysis used in this figure were paired and unpaired one-way ANOVA with Tukey post-hoc analysis

Figure Data
Acknowledgments
This image is the copyrighted work of the attributed author or publisher, and ZFIN has permission only to display this image to its users. Additional permissions should be obtained from the applicable author or publisher of the image. Full text @ Mol. Brain