
Figure 7
- ID
- ZDB-IMAGE-210825-45
- Publication
- Dray et al., 2021 - Dynamic spatiotemporal coordination of neural stem cell fate decisions occurs through local feedback in the adult vertebrate brain
- All Figures
- Figures for Dray et al., 2021
|
Figure 7
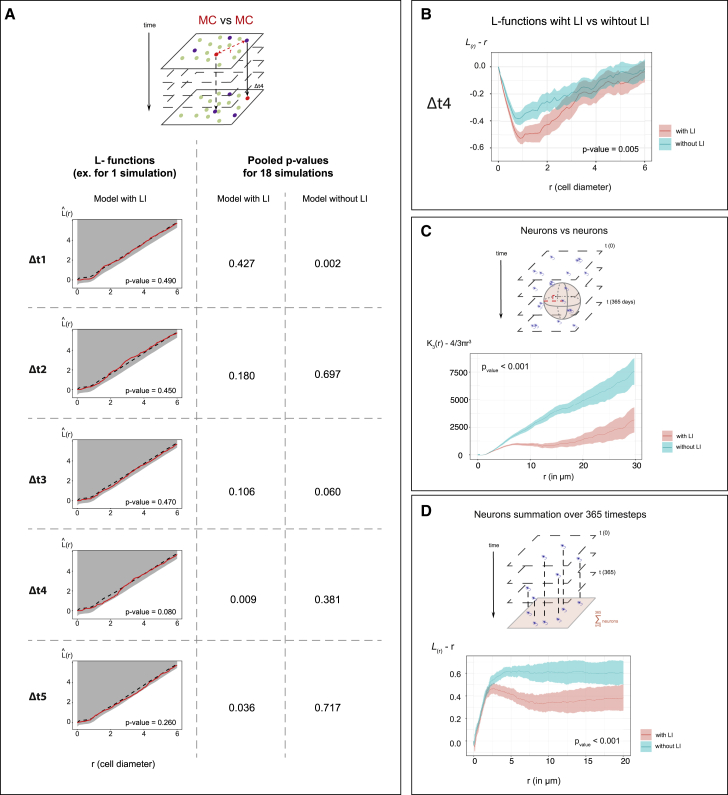
The NSC lattice model reproduces the spatiotemporal correlations of NSC fate decisions and shows their impact on long-term neuronal distribution
(A) Top: MC positions at any time t in the lattice model are compared using point pattern statistics with MC positions at t+Δt. Bottom left: Besag’s
(B) Compared
(C) Compared spatial interaction between output neurons in a model with (pink) and without (blue) LI, using a 3D Ripley’s
(D) Similar comparison (to C) in 2D, using the
(B)–(D) show centered summary functions,