IMAGE

Figure 7

ID
ZDB-IMAGE-210822-16
Source
Figures for Holmgren et al., 2021
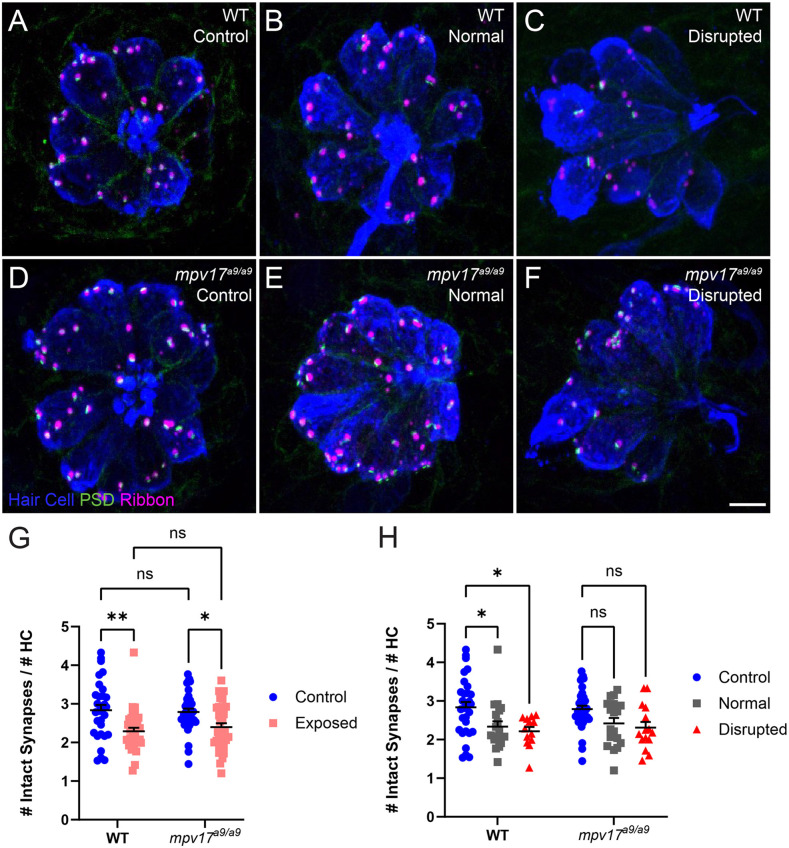
Image
Figure Caption

Figure 7

Both WT and mpv17a9/a9 neuromasts experience mechanically induced hair-cell synapse loss. (A–C) Maximum-intensity projections of confocal images showing neuromasts with Parvalbumin-labeled hair cells (blue), Ribeye b-labeled presynaptic ribbons (magenta), and MAGUK-labeled PSD (green). Unexposed control neuromasts are shown in (A; WT) and (D; mpv17a9/a9); exposed neuromasts with normal morphology are shown in (B; WT) and (E; mpv17a9/a9); and exposed neuromasts with disrupted morphology are shown in (C; WT) and (F; mpv17a9/a9). (G,H) Quantification of average numbers of intact synapses per hair cell. Each data point refers to the average number of intact synapses per hair cell in one neuromast per fish. Synapse number is reduced in both WT and mpv17a9/a9 neuromasts (G; **P = 0.0020 WT; *P = 0.0313 mpv17a9/a9). This reduction was consistent in both normal and disrupted neuromasts (H; *P = 0.0483 WT normal; *P = 0.0272 WT disrupted). n = 13–36 fish (neuromasts L3, L4, and L5); N = 7 experimental trials. Scale bar: 5 μm. Error bars: SEM. “ns” = not significant. PSD, postsynaptic density.

Acknowledgments
This image is the copyrighted work of the attributed author or publisher, and ZFIN has permission only to display this image to its users. Additional permissions should be obtained from the applicable author or publisher of the image. Full text @ Front. Cell. Neurosci.