
IMAGE
Figure 2
- ID
- ZDB-IMAGE-210822-11
- Publication
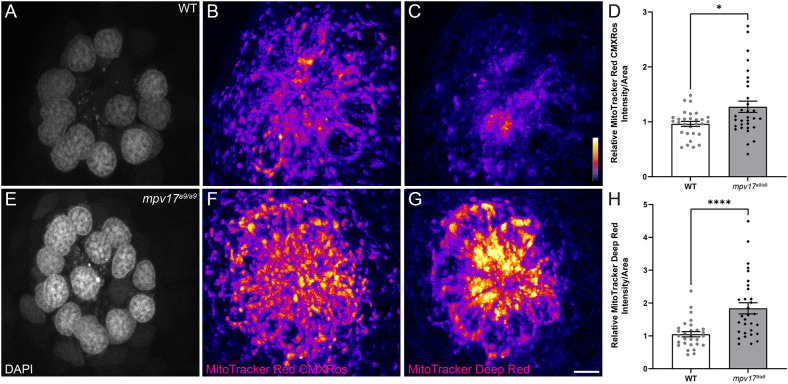
- Holmgren et al., 2021 - Influence of Mpv17 on Hair-Cell Mitochondrial Homeostasis, Synapse Integrity, and Vulnerability to Damage in the Zebrafish Lateral Line
- All Figures
- Figures for Holmgren et al., 2021
Image
|
Figure Caption
Figure 2
Acknowledgments
This image is the copyrighted work of the attributed author or publisher, and
ZFIN has permission only to display this image to its users.
Additional permissions should be obtained from the applicable author or publisher of the image.
Full text @ Front. Cell. Neurosci.