
Fig 5
- ID
- ZDB-IMAGE-210821-7
- Publication
- Kuil et al., 2021 - Size matters: Large copy number losses in Hirschsprung disease patients reveal genes involved in enteric nervous system development
- All Figures
- Figures for Kuil et al., 2021
|
Fig 5
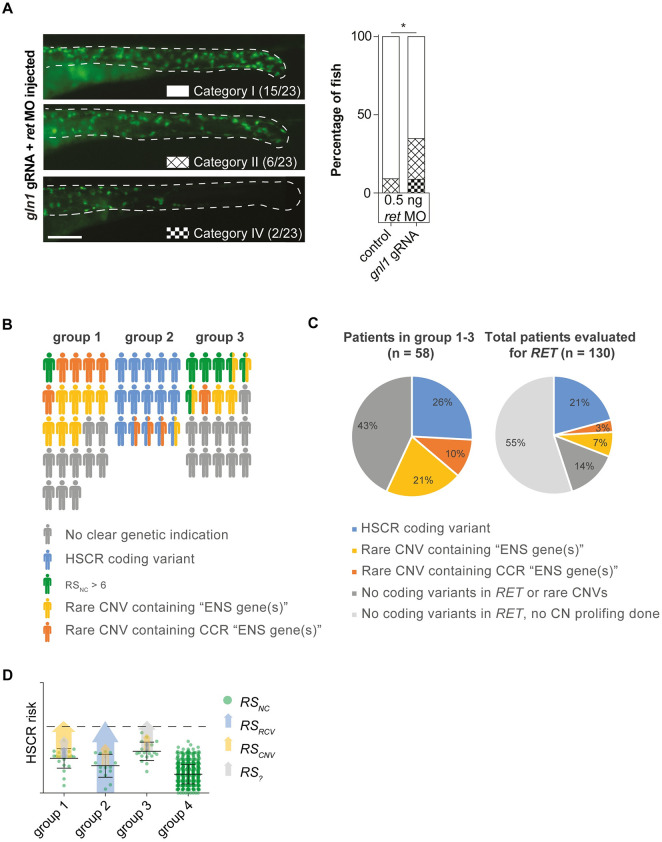
(A) A second injection round targeting gnl1, using a lower dose of ret morpholino, confirmed gnl1 epistasis with Ret. Statistical tests used: "N-1" Chi-squared test; * p < 0.05 (B) Visual representation of the distribution of genetic predispositions over HSCR patient groups. In total 197 patients born between 1973 and 2018 were evaluated by a clinical geneticist in the department of Clinical Genetics, Erasmus Medical Center, Rotterdam. Of these, 114 did not have associated anomalies nor a known syndrome. 29 patients had a known HSCR related genetic syndrome, including Down syndrome (n = 18). 153 out of 197 patients were genetically evaluated for RET gene involvement and 21 had a pathogenic RET variant. (C) Pie charts showing the incidence of rare CNVs containing “ENS genes”, CCR “ENS genes” and coding variants in HSCR patients. (D) Graphical representation of a hypothetical model explaining the relative contributions of the risk scores in our 3 patient groups. Error bars represent standard deviation.