
Fig. EV3
- ID
- ZDB-IMAGE-210817-24
- Publication
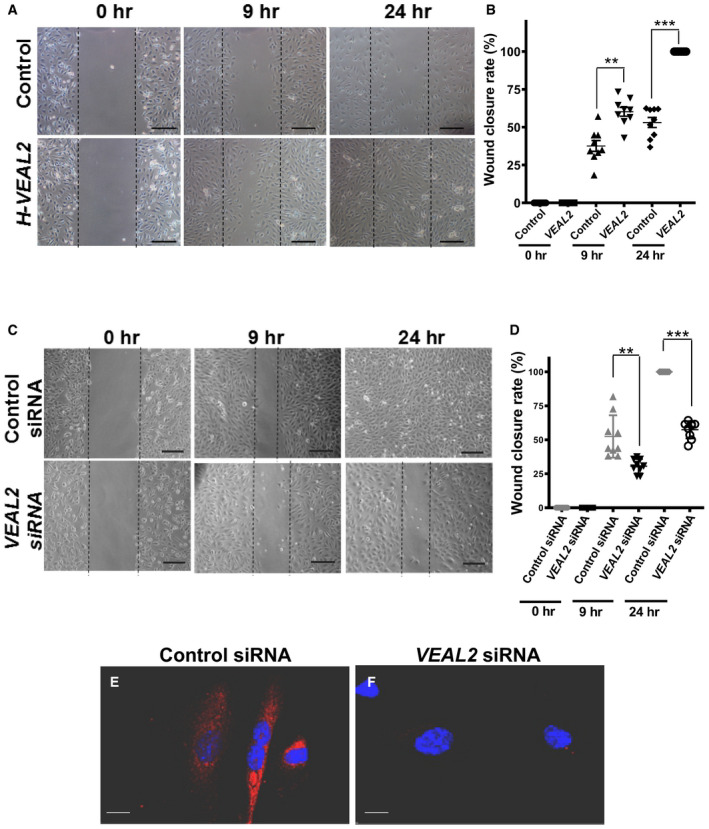
- Sehgal et al., 2021 - LncRNA VEAL2 regulates PRKCB2 to modulate endothelial permeability in diabetic retinopathy
- All Figures
- Figures for Sehgal et al., 2021
|
Fig. EV3
Representative images showing wound closure rate in overexpressed Dot plot representing wound closure rate at 0, 9, and 24 h post‐scratch in control cells and Representative images showing wound closure rate in control siRNA‐ and Dot plot representing wound closure rate at initial time, 9, and 24 h post‐scratch in control siRNA‐ and smFISH of
Data information: All the experiments