IMAGE

Fig. EV1

ID
ZDB-IMAGE-210817-19
Source
Figures for Sehgal et al., 2021
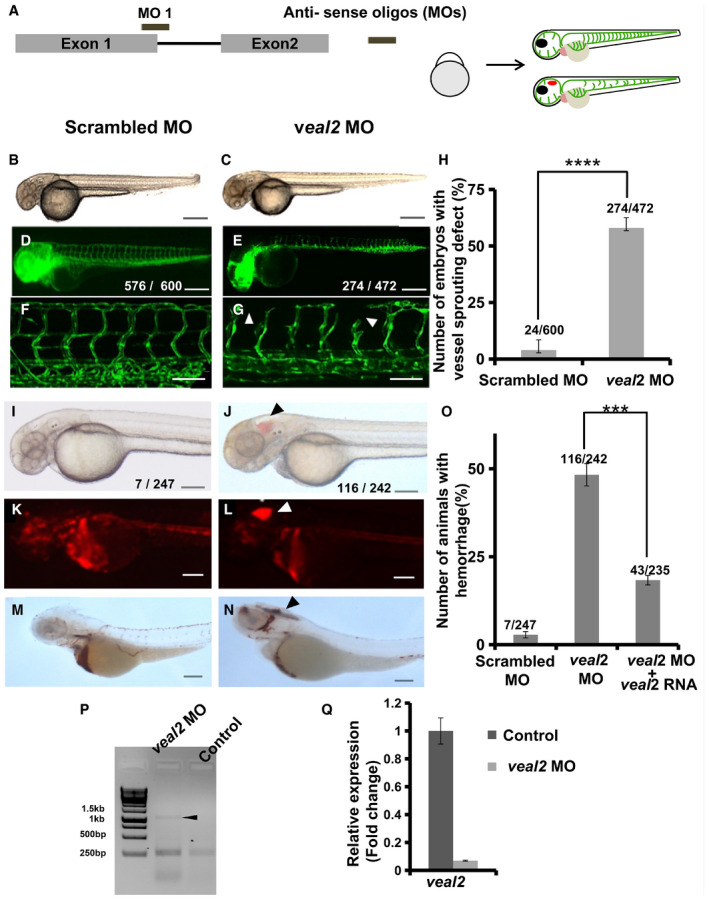
Image
Figure Caption

Fig. EV1 Knockdown of <italic toggle='yes'>veal2</italic> transcript in zebrafish embryos leads to vessel patterning and integrity defects

Schema representing the design of splice‐block morpholino on veal2 transcript and injection into one‐cell staged double transgenic gib004Tg(fli1a:EGFP;gata1a:DsRed) zebrafish embryos by microinjection (3 nl at 500 μM). The injected embryos were further screened at 2 dpf for phenotypic changes.

Representative images of morpholino‐injected zebrafish at 2 dpf under bright field and EGFP filter. (B, D, F) Embryos injected with scrambled morpholinos. (C, E, G) Embryos injected with the veal2 morpholino. veal2 knockdown induces sprouting defects (indicated by arrowheads). (B–E) 5× magnification. Scale bars represent 100 μm. (F–G) 20× magnification. Scale bars represent 50 μm.

Bar graph representing a number of animals displaying vascular sprouting defects in veal2 morpholino‐injected zebrafish at 2 dpf. Data from three different experiments plotted as mean percentage values ± standard deviation.

Representative images of morpholino‐injected 2 dpf zebrafish under bright field, mRFP filter and animals stained with O‐dianisidine. (I, K, M) Embryos injected with non‐targeting control (NTC) morpholino. (J, L, N) Embryos injected with the veal2 morpholino. Arrowheads show the presence of hemorrhage due to the vascular integrity defects. (I–N) 5× magnification. Scale bars represent 100 μm.

Percentage of animals that showed vascular integrity defects at 2 dpf when injected with 3 nl of 500 μM scrambled morpholino, 500 μM veal2 morpholino and cocktail of 500 μM veal2 morpholino and 100 ng of veal2 RNA. Data from three different biological replicates represented as mean percentage ± standard deviation.

Gel represents the PCR‐amplified products using primers designed across the intron. The arrowhead indicates the product with retention of the intron due to the effect of morpholino.

Relative expression of veal2 across control and veal2 knockdown embryos. actb was taken as normalization control. Data from three different experiments represented as mean ΔΔCT values normalized to EC values ± standard deviation.

Data information: All the experiments N ≥ 3. ***P‐value < 1E‐3 and ****P‐value < 1E‐4. Statistics: unpaired two‐tailed t‐test.

Acknowledgments
This image is the copyrighted work of the attributed author or publisher, and ZFIN has permission only to display this image to its users. Additional permissions should be obtained from the applicable author or publisher of the image. Full text @ EMBO J.