
Image
|
Figure Caption
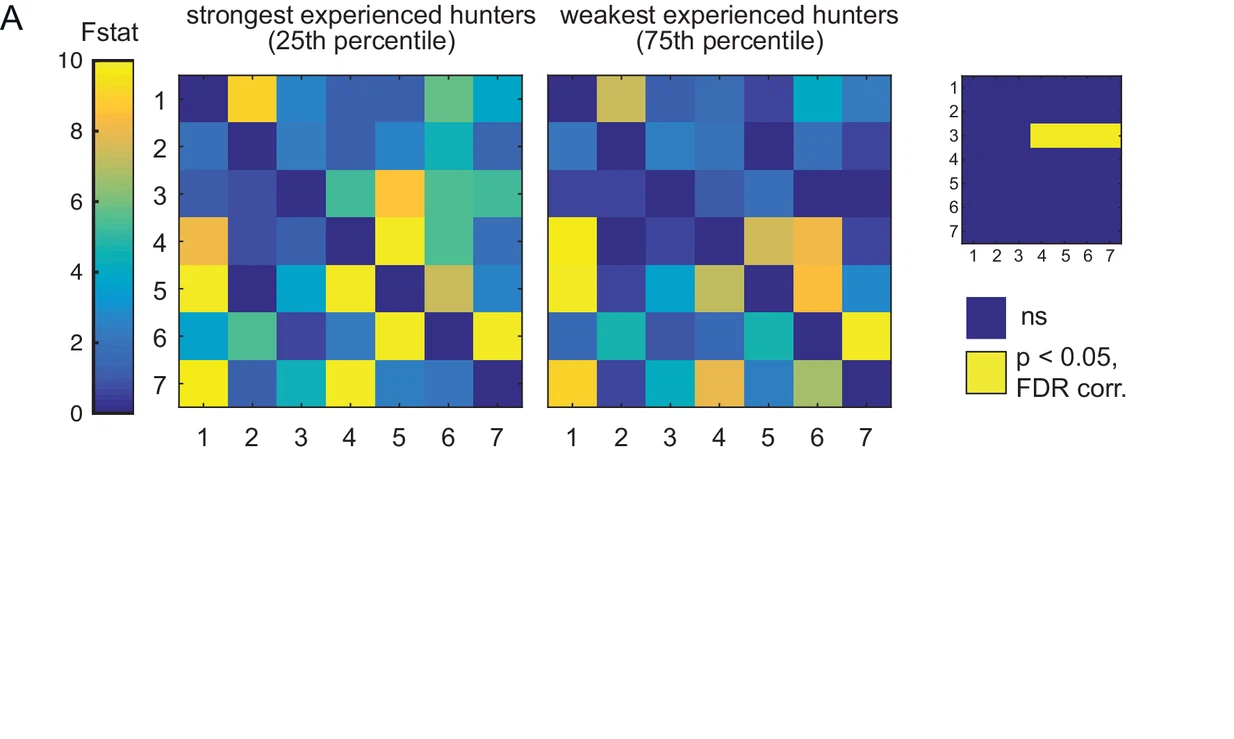
Fig. 5.1 (A) Prey-experienced fish ranked by frequency of evoked eye convergence (with prey – without prey) into strongest quartile (N = 5, left) and weakest quartile (N = 5, right). Average Granger-causality matrices for same regions as Figure 5. Inset: Pairwise statistical comparison (Ts) of all links (see Supplementary file 3 for p-values). Data table for panel A in Figure 5—figure supplement 1—source data 1.
Acknowledgments
This image is the copyrighted work of the attributed author or publisher, and
ZFIN has permission only to display this image to its users.
Additional permissions should be obtained from the applicable author or publisher of the image.
Full text @ Elife