
|
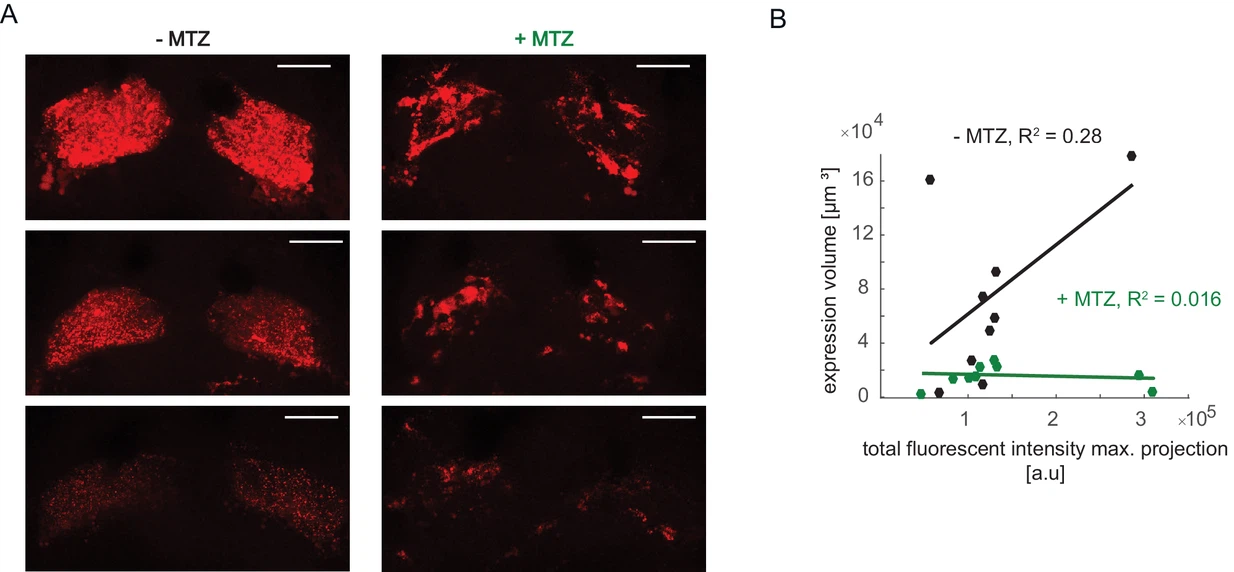
Fig. 7.2 (A) Examples of mCherry pattern in healthy control habenulae of NTR+ fish treated with vehicle only (-MTZ) and metronidazole-treated (+MTZ). Although brightness levels vary, the -MTZ controls show a typical diffuse pattern, whereas the +MTZ-treated animals have a blotchy distribution. Scale bar represents 40 μm. (B) Relation between total fluorescent intensity in maximum projection of Z-stacks and calculated expression volume. Symbols represent individual fish, a permutation test was used for all pairwise comparisons unless specified otherwise (see Materials and methods, Behavioral data analysis and statistics). Data table for panel B is in (Figure 7—figure supplement 2—source data 1).