
Image
|
Figure Caption
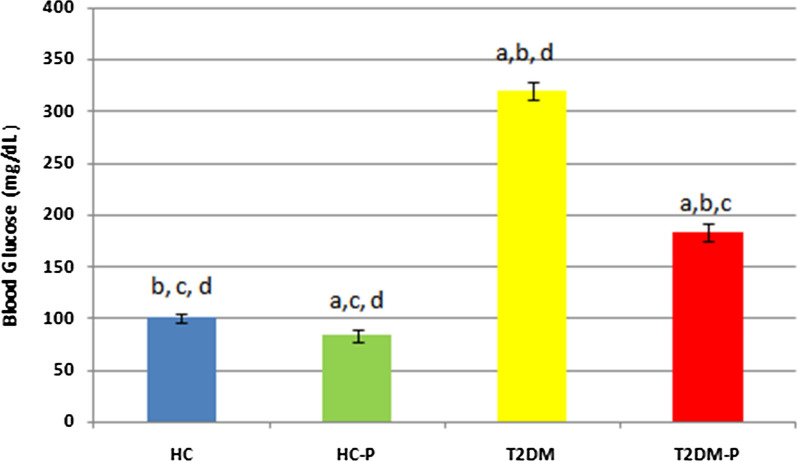
Fig. 1
This diagram represents the result of blood glucose from all trail groups. Data represents the mean + SE of the results for three independent assays. Statistical analysis compares difference of the mean of results between T2DM-P and HC, HC-P and T2DM.
Figure Data
Acknowledgments
This image is the copyrighted work of the attributed author or publisher, and
ZFIN has permission only to display this image to its users.
Additional permissions should be obtained from the applicable author or publisher of the image.
Full text @ BMC Res. Notes