
Image
|
Figure Caption
Figure 7
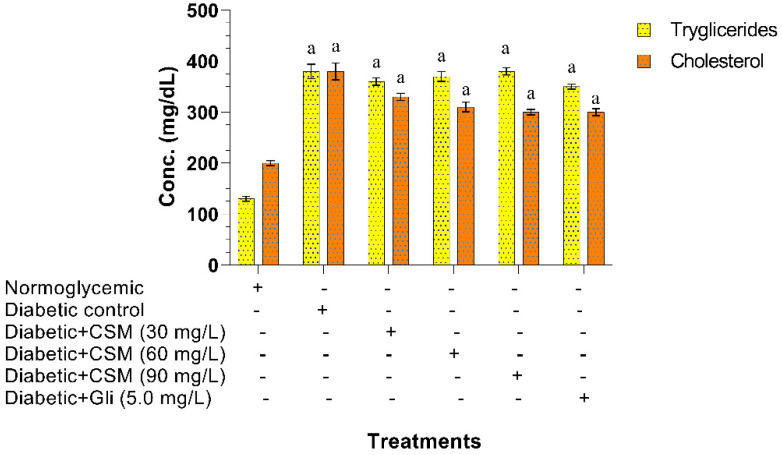
Figure 7. Effect of CSM on glucose-induced zebrafish triglycerides and cholesterol levels at the end of the experimental period (14 days). Data are expressed as the mean ± SE. a p ≤ 0.05. when compared to normoglycemic control group. The letters indicate significant differences between the different treatments. CSM; methanol extract from the seed of S. purpurea, Gli; glibenclamide.
Figure Data
Acknowledgments
This image is the copyrighted work of the attributed author or publisher, and
ZFIN has permission only to display this image to its users.
Additional permissions should be obtained from the applicable author or publisher of the image.
Full text @ Plants (Basel)