IMAGE

Fig. 8

ID
ZDB-IMAGE-210813-28
Source
Figures for Topel et al., 2020
Image
Figure Caption

Fig. 8

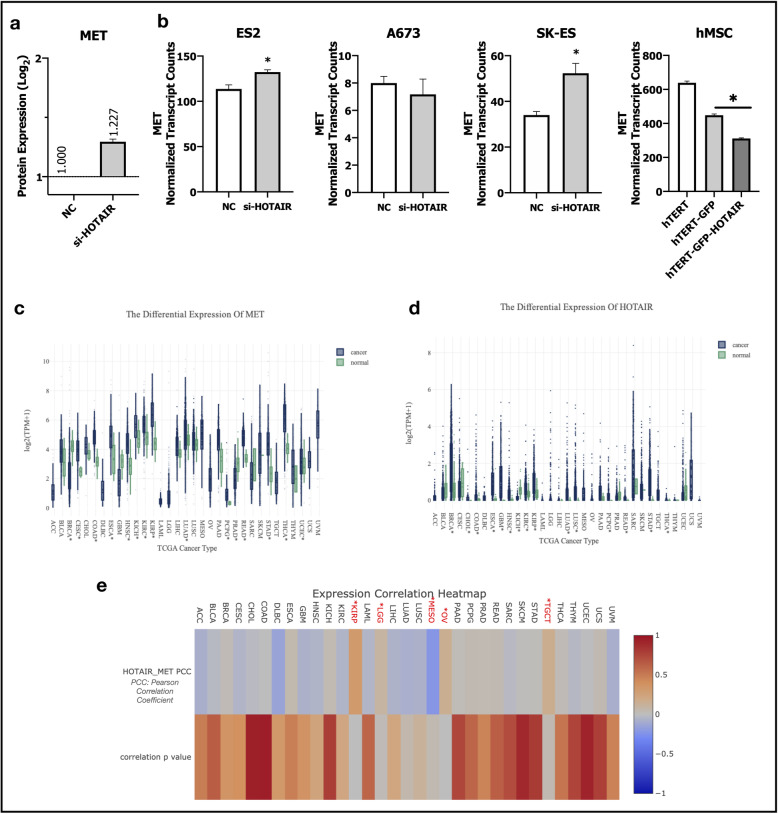
Bioinformatic analyses of GEO and TCGA datasets supports HOTAIR and c-Met interplay. (a) Column graph of c-Met protein expression in control-siRNA and HOTAIR-siRNA transfected HepG2 cells in GEO dataset GSE98091. (b) MET gene expression in experimental groups of GEO dataset GSE109483. Column graphs of control-GapMeR and HOTAIR-GapmeR transfected Ewing sarcoma cell lines ES2, A673 and SK-ES (1st, 2nd and 3rd graphs). Last graph belongs to hTERT-immortalized human mesenchymal stem cells (hMSC), hMSCs transfected with GFP (hTERT-GFP) and HOTAIR-GFP (hTERT-GFP-HOTAIR) overexpression vectors. Analysis of (c) MET (d) HOTAIR gene expressions in TCGA datasets. (e) Heatmap of gene expression correlation analysis of HOTAIR and MET in TCGA datasets. GEO dataset analysis are performed with GREIN and TCGA gene expression and correlation analysis are performed with LncTarD. * p ≤ 0.05

Acknowledgments
This image is the copyrighted work of the attributed author or publisher, and ZFIN has permission only to display this image to its users. Additional permissions should be obtained from the applicable author or publisher of the image. Full text @ Cell Commun. Signal.