
Figure 7
- ID
- ZDB-IMAGE-210813-12
- Publication
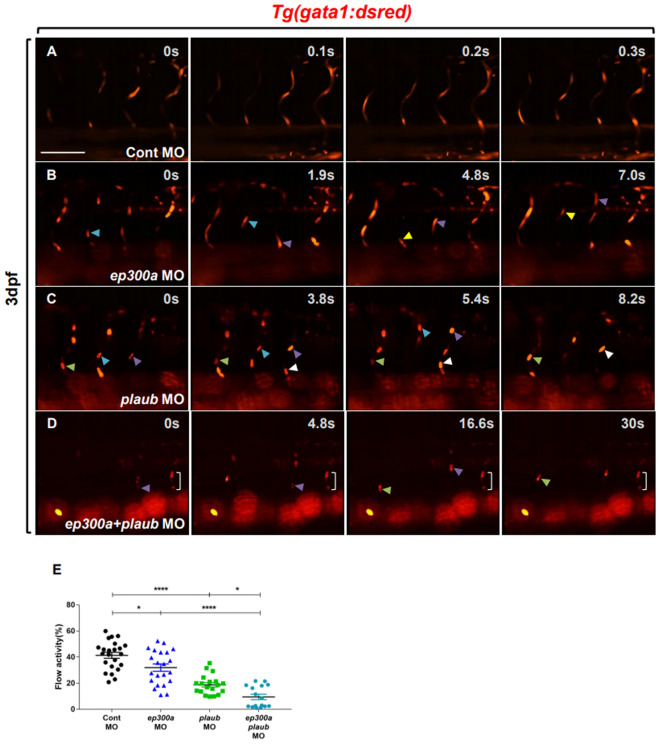
- Park et al., 2021 - Identification of de novo EP300 and PLAU variants in a patient with Rubinstein-Taybi syndrome-related arterial vasculopathy and skeletal anomaly
- All Figures
- Figures for Park et al., 2021
|
Figure 7
Knockdown of