
Image
|
Figure Caption
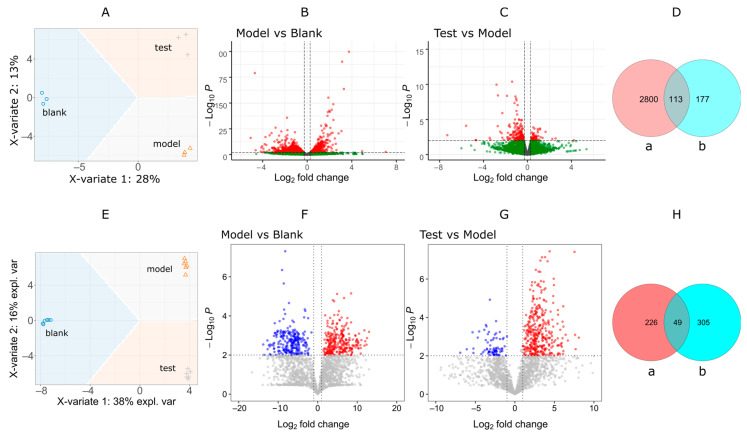
Figure 5 Visual analysis of differentially expressed genes (DEGs) and differential metabolites (DMs). (A) sPLS-DA analysis of DEGs. (B,C) valcono plot of DEGs (p < 0.01). (D) Venn plots of DEG counts. a, model vs. blank; b, test vs. model. (E) sPLS-DA analysis of DMs. (F,G) valcono plot of DMs (FC > 2, p < 0.01). (H) Venn plots of DM counts. a, model vs. blank; b, test vs. model.
Acknowledgments
This image is the copyrighted work of the attributed author or publisher, and
ZFIN has permission only to display this image to its users.
Additional permissions should be obtained from the applicable author or publisher of the image.
Full text @ Pharmaceuticals (Basel)