
Image
|
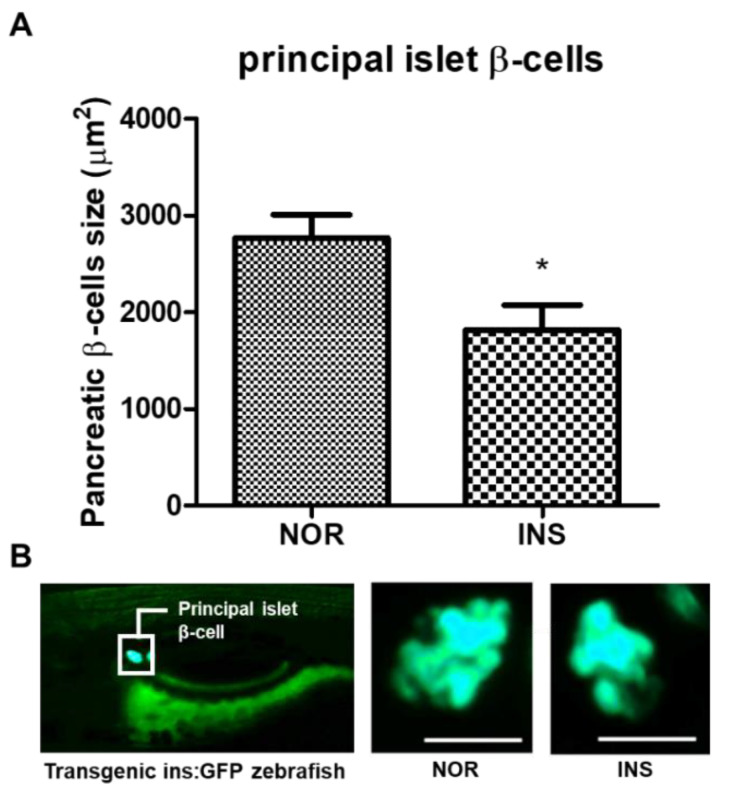
Figure Caption
Figure 3 Changes in pancreatic β-cells following insulin (INS) treatment. (A) Principal islet β-cells’ size of the excess insulin-treated zebrafish (n = 20). (*) p < 0.05; compared to normal (NOR). (B) Fluorescent microscopic image of the principal islet β-cells. Scale bar = 100 μm.
Acknowledgments
This image is the copyrighted work of the attributed author or publisher, and
ZFIN has permission only to display this image to its users.
Additional permissions should be obtained from the applicable author or publisher of the image.
Full text @ Pharmaceuticals (Basel)