
Image
|
Figure Caption
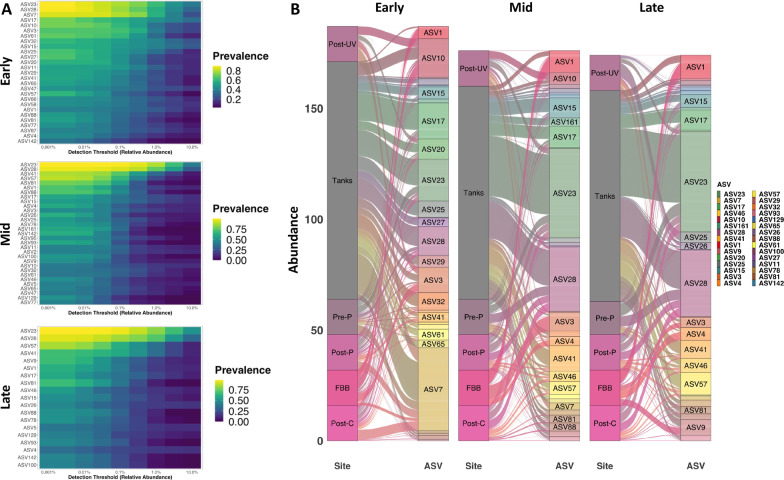
Fig. 5
Limited number of taxa comprise core community throughout equilibration. Heatmaps showing prevalence (legend at right) of core ASVs at increasing thresholds of relative abundance at Early (TP1 to TP4), Mid (TP5 to TP8), and Late (TP9 to TP12) time-points (
Acknowledgments
This image is the copyrighted work of the attributed author or publisher, and
ZFIN has permission only to display this image to its users.
Additional permissions should be obtained from the applicable author or publisher of the image.
Full text @ Anim Microbiome