
|
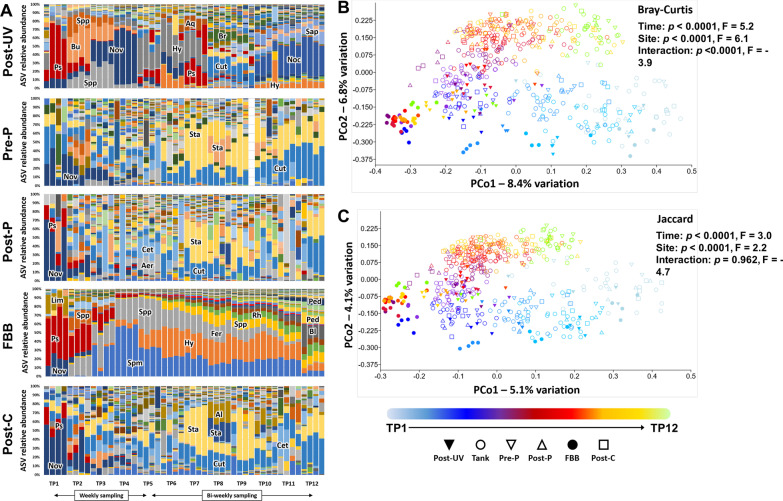
Fig. 4 Post-UV disinfection water and FBB harbor dynamic communities, distinct from other sites. Stacked bar charts showing the progression in microbiome composition in the post-UV disinfection water entering the tanks (Post-UV disinfection), the pre- and post-particulate filter water (Pre-P and Post-P, respectively), the fluidized bed biofilter (FBB), and post-carbon filter water (Post-C), sampled at 12 time-points (4 replicates/time-point); ASV = amplicon sequence variant, Aer = Aeromonas, Al = Alloiococcus, Aq = Aquabacterium, Bl = Blastocatellaceae, Br = Bradyrhizobium, Bu = Burkholderiaceae, Cet = Cetobacterium, Ch = Chitinophagales, Cut = Cutibacterium, FBB = fluidized bed biofilter, Fer = Ferruginibacter, Hy = Hydrogenophaga, Lim = Limnobacter, Noc = Nocardia, Nov = Novosphingobium, Ped = Pedosphaeraceae, Per = Perlucidibaca, Pl = Plesiomonas, Ps = Pseudomonas, Rh = Rhodobacteraceae, Sap = Saprospiraceae, Spp = Sphingopyxis, Spm = Sphingomonadaceae, Sta = Staphylococcus, Vib = Vibrio (A) and principal coordinate analysis plots of those samples and tank water, based on Bray–Curtis (B) and Jaccard (C) similarities. ASV = amplicon sequence variant, TP = time-point, color-bar and symbol legends at bottom; taxonomic abbreviations listed at beginning of manuscript. p and F values associated with main effects of time and sample site based on two-way permutation multivariate analysis of variance (PERMANOVA)