
Fig. 6
- ID
- ZDB-IMAGE-210804-19
- Genes
- Publication
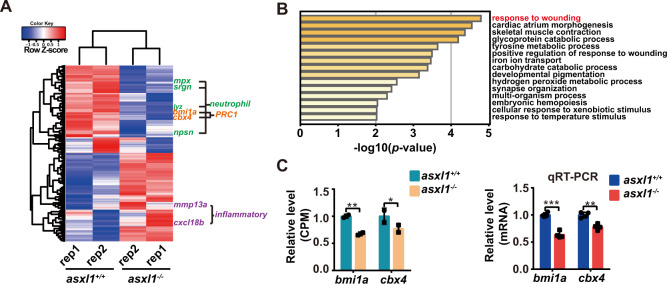
- Fang et al., 2021 - Asxl1 C-terminal mutation perturbs neutrophil differentiation in zebrafish
- All Figures
- Figures for Fang et al., 2021
|
Fig. 6