Image
Figure Caption

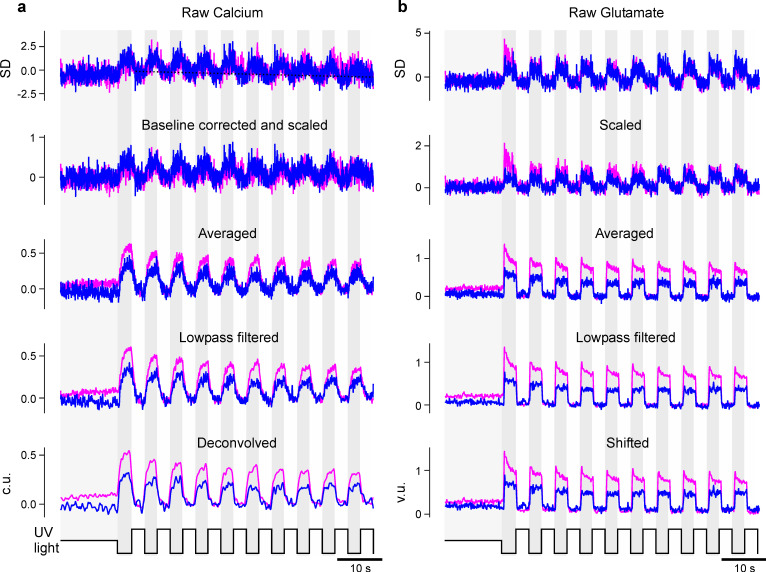
Figure 3—figure supplement 1. Preprocessing of calcium and glutamate recordings.

(a) The raw (z-scored) calcium data is first corrected for a linear decay of the baseline (dotted black line). It is then scaled such that the UV-bright intervals have mean 0 and standard deviation 1 (second row). After averaging all recordings of one zone (third row), the traces are then lowpass filtered and finally deconvolved (last row). We only included the acute zone (AZ) and nasal zone in this illustration. (b) As (a) but for the glutamate data, but no baseline correction and deconvolution was applied. As a final step, the glutamate traces were shifted to have only non-negative values (last row).

Acknowledgments
This image is the copyrighted work of the attributed author or publisher, and ZFIN has permission only to display this image to its users. Additional permissions should be obtained from the applicable author or publisher of the image. Full text @ Elife