
Image
|
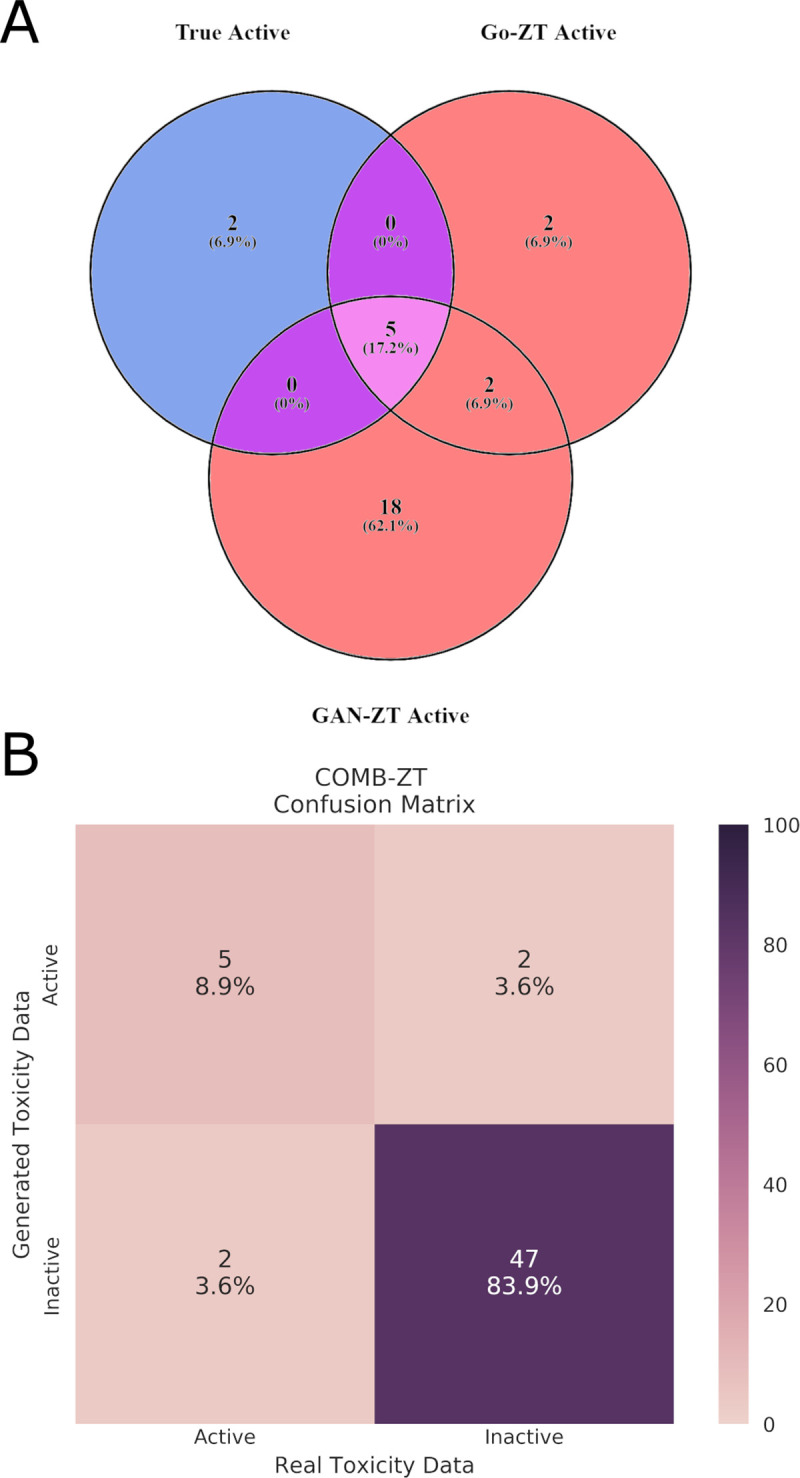
Figure Caption
Fig 8
(A)Venn diagram showing the overlap between true active chemicals and chemicals predicted to be active by either Go-ZT or GAN-ZT. (B) A confusion matrix showing the performance of the combined Go-ZT and GAN-ZT models using the test dataset.
Acknowledgments
This image is the copyrighted work of the attributed author or publisher, and
ZFIN has permission only to display this image to its users.
Additional permissions should be obtained from the applicable author or publisher of the image.
Full text @ PLoS Comput. Biol.