
Image
|
Figure Caption
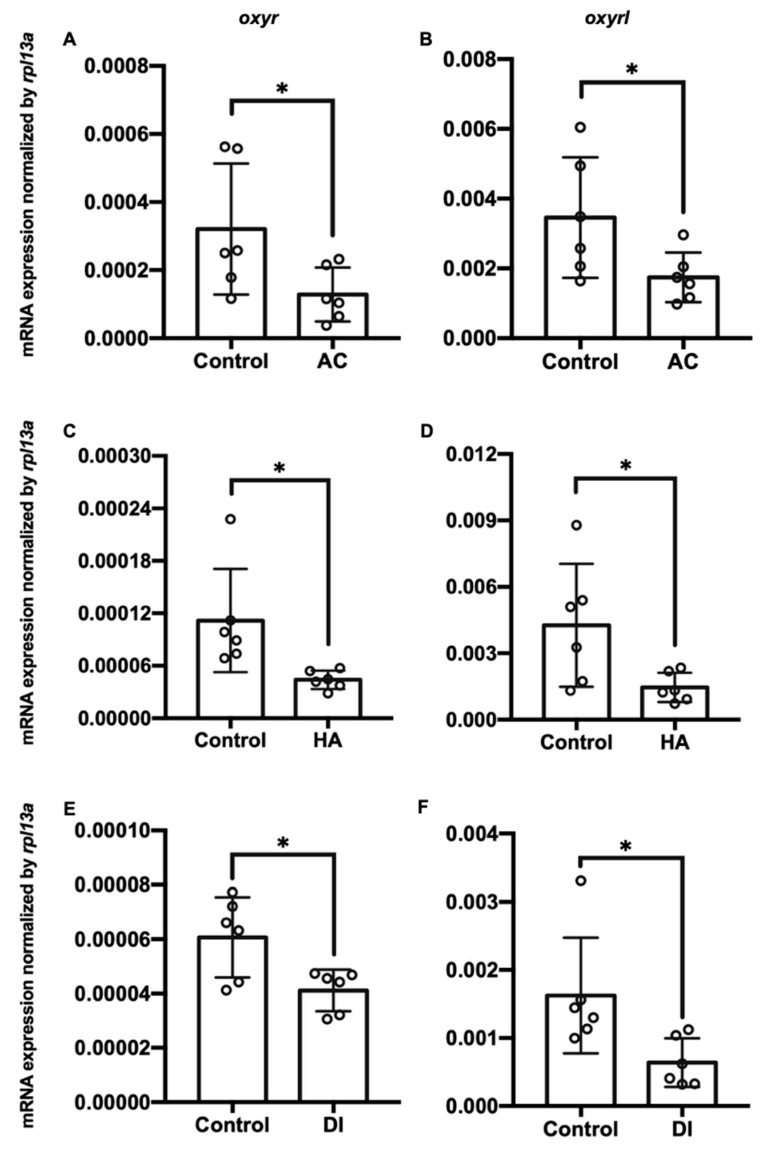
Figure 2 Charts showing mRNA expression of oxyr and oxyrl in the gills of adult zebrafish acclimated to (A,B) acidic (AC), (C,D) high-ammonia (HA), or (E,F) double-deionized (DI) water for 7 days. Rpl13a was used as an internal control to normalize relative expression. Each circle represents the data of one single fish. The asterisks (*) indicate significant differences between the control and treatment groups. Values are means ± SD (n = 6, p < 0.05 (Student’s t-test)).
Acknowledgments
This image is the copyrighted work of the attributed author or publisher, and
ZFIN has permission only to display this image to its users.
Additional permissions should be obtained from the applicable author or publisher of the image.
Full text @ Int. J. Mol. Sci.