
|
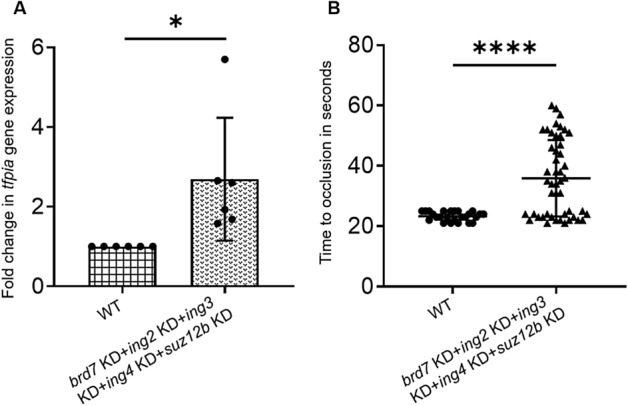
Figure 4 Simultaneous 5-gene knockdowns in adults and larvae. (A) Quantitative real-time PCR showing the fold change of tfpia gene expression in liver and spleen in simultaneous knockdown of 5 chromatin binding and regulatory protein genes, (brd7 + ing2 + ing3 + ing4 + suz12b) with wild-type (WT) controls using Student’s t test. The bar graphs represent wild-type control (squared bar) and simultaneous 5-gene knockdown (dotted bar). Error bars represent mean ± SD. Six fish were used for each of the simultaneous 5-gene knockdown and control experiments (N = 6); (B) Comparison of time to occlusion of the caudal vein after laser injury between wild-type control 5 dpf larvae and simultaneous 5-gene knockdown larvae (brd7 + ing2 + ing3 + ing4 + suz12b) by Student’s t test. The dot plots represent wild-type larvae (closed circles) and the knockdown larvae (closed triangles). Error bars represent mean ± SD. For experiments in (A) and (B), p-value < 0.05 was considered significant, and 50 larvae each were used in control and knockdown experiments (N = 50). The lines on the top represent a significant difference between wild-type and knockdown samples. * and **** represent p ≤ 0.05 and p ≤ 0.0001, respectively.