
|
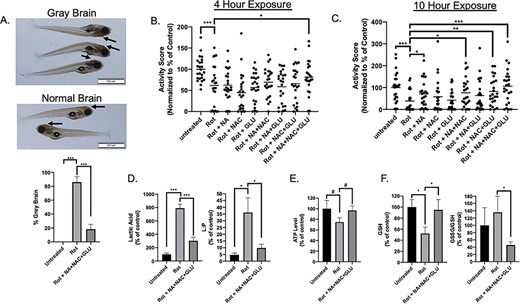
Fig. 6 Combination Glu + NA + NAC treatment protected zebrafish larvae from rotenone-induced brain death, reduced swimming activity, and key biochemical hallmarks of mitochondrial complex I dysfunction. (A) Brain death (gray brain, indicated by arrows) was induced with 150 nM rotenone exposure in wild-type (AB) fish for approximately 5 h on 7 days post-fertilization (dpf). Pre-treating wild-type (AB) zebrafish beginning at 5 dpf with combinational GLU + NA + NAC therapy significantly prevented the brain death (golden color of brain, indicated by arrows) upon co-exposure to 150 nM rotenone at 7 dpf and combinational treatment for 5 h (P < 0.001). Three independent biological replicates were performed per condition, with n ≥ 15 animals in each condition per replicate. (B) Zebrafish larval swimming activity was quantified by exposure for 10 h to repetitive light cycles of 60% light for 20 min followed by 0% light for 20 min during rotenone co-exposure at 7 dpf. Independent experimental data was collected by ZebraBox (Viewpoint Life Sciences) analysis, with activity scores in the first 5 min of each dark period averaged across three independent biological replicate experiments with data normalized as percent of wild-type buffer-only control for each independent biological replicate (see Supplementary Material, Fig. S9). Effects of pre-treatment with Glu + NA + NAC triple combination therapy, along with each of the single and double permutations were evaluated, with activity score shown after rotenone (150 nM) co-exposure for 4 h, to assess biochemical mechanism before the 5-h peak when maximal brain death was observed. Data are represented in a scatter plot, with n = 8 animals per condition studied in each replicate. (C) Zebrafish larval swimming activity was quantified following pre-treatment with Glu + NA + NAC triple combination therapy, along with each of the single and double permutations, with activity score shown after 10 h co-exposure to rotenone (150 nM). n = 8 zebrafish larvae per condition in each replicate. (D) Zebrafish lactate and lactate:pyruvate ratios. Lactate levels were quantified in wild-type (AB) zebrafish (20 fish per replicate for each condition) in buffer or after rotenone exposure for 4 h either with or without Glu + NA + NAC pre-treatment from 5 dpf. Significant differences were seen between all treatment group (***, P < 0.001). Specifically, lactic acid mean levels were 279 pmol/larvae in buffer-only control larvae (n = 6 biological replicates), 2202 pmol/larvae in 150 nM rotenone ×4 h exposed larvae (n = 4 biological replicates), and 841 pmol/larvae in Glu + NA + NAC pre-treated rotenone ×4 h exposed larvae (n = 6 biological replicates). Pyruvate levels were not significantly changed between groups (Supplementary Material, Fig. S9). However, lactate-to-pyruvate (L:P) ratio was significantly increased in rotenone-exposed larvae and partially normalized with Glu + NA + NAC pre-treatment (*, P < 0.05). (E) ATP levels. Wild-type (AB) zebrafish (20 fish per replicate for each condition) pre-treated from 5 dpf with GLU + NA + NAC combinational therapy (n = 6 biological replicates) showed a trend toward improved ATP concentration upon evaluation after 4h rotenone exposure at 7 dpf as compared to rotenone (150 nM) exposed larvae for 4 h at 7 dpf without pre-treatment (n = 4 biological replicates). Specifically, ATP mean concentration in untreated AB zebrafish was 346 pmol per larvae, in rotenone-exposed AB zebrafish was 259 pmol per larvae, and in Glu + NA + NAC pre-treated zebrafish before rotenone exposure was 335 pmol per larvae. #, P ≤ 0.1. (F) Glutathione levels. Wild-type (AB) zebrafish (20 fish per replicate for each condition) exposed to 150 nM rotenone for 4 h (n = 7 biological replicates) had lower GSH mean concentration (85 pmol per larvae) than buffer-only control larvae (161 pmol per larvae (n = 6 biological replicates). Pre-treatment from 5 dpf with GLU + NA + NAC combinational therapy (n = 7 biological replicates) normalized GSH level (153 pmol per larvae), similar to that seen in buffer-control wild-type larvae. Glu + NA + NAC pre-treatment also significantly lowered the GSSG/GSH ratio relative to rotenone-only exposure without pre-treatment. Statistical significance between experimental conditions was assessed by Student’s t-test in Graphpad Prism 7.04, #, P ≤ 0.1, *, P < 0.05, **, P < 0.01, and ***, P < 0.001. Bars indicate mean and standard error of mean.