IMAGE

FIGURE 4

ID
ZDB-IMAGE-210729-27
Source
Figures for Tang et al., 2021
Image
Figure Caption

FIGURE 4

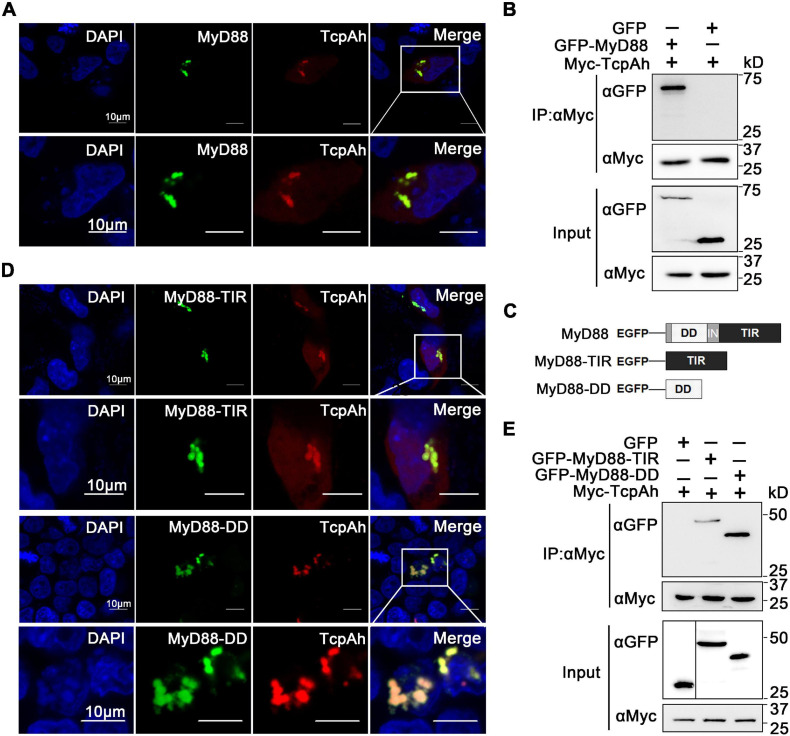
Interaction between TcpAh and MyD88 by TIR–TIR and TIR–DD interactions. (A) Co-localization analysis of TcpAh and zebrafish MyD88 proteins in HEK293T cells by confocal microscopy (Zeiss LSM 710; original magnification, 630×). The nucleus was stained with DAPI. Scale bars correspond to 10 μm. (B) Co-IP analysis between TcpAh and zebrafish MyD88 proteins from HEK293T cells expressing Myc-TcpAh with GFP or GFP-MyD88. (C) Schematic diagram of wild-type and domain-truncated zebrafish MyD88 forms. (D) Co-localization analysis between TcpAh and truncated MyD88 proteins in HEK293T cells by confocal microscopy (Zeiss LSM 710; original magnification, 630×). The nucleus was stained with DAPI. Scale bars correspond to 10 μm. (E) Co-IP assay between TcpAh and MyD88-TIR domain (148–284 aa) or MyD88-DD domain (11–101 aa) as shown in (B), except MyD88-TIR or MyD88-DD was used instead of full-length wild-type MyD88.

Acknowledgments
This image is the copyrighted work of the attributed author or publisher, and ZFIN has permission only to display this image to its users. Additional permissions should be obtained from the applicable author or publisher of the image. Full text @ Front Microbiol