IMAGE

Fig. 7

ID
ZDB-IMAGE-210729-24
Source
Figures for Li et al., 2021
Image
Figure Caption

Fig. 7

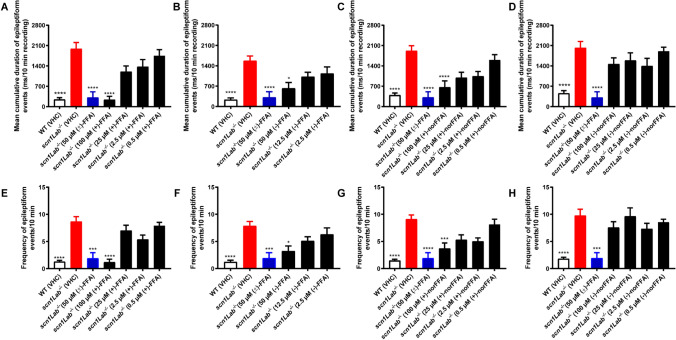
Electrophysiological antiepileptic activity of (+)-FFA (A, E), (−)-FFA (B, F), (+)-norFFA (C, G) and (−)-norFFA (D, H) in the scn1Lab/ mutant model, and ( ±)-FFA (colored in blue, AH) used as a positive control. (AH) Noninvasive local field potential (LFP) recordings from the optic tectum of larvae pre-exposed to (+)-FFA, (−)-FFA, (+)-norFFA and (−)-norFFA for 22 h. Epileptiform discharges are quantified by the cumulative duration (mean ± SEM) (AD) and frequency (mean ± SEM) (EH) of events per 10-min recording. With 27–45 larvae for each VHC-treated group, and 10–16 larvae for each compound-treated group. Statistical analysis: Kruskal–Wallis testing with Dunn’s multiple comparisons. Significance levels: *p ≤ 0.05, **p ≤ 0.01, ***p ≤ 0.001, ****p ≤ 0.0001. WT wild type, VHC vehicle, FFA fenfluramine, norFFA norfenfluramine

Acknowledgments
This image is the copyrighted work of the attributed author or publisher, and ZFIN has permission only to display this image to its users. Additional permissions should be obtained from the applicable author or publisher of the image. Full text @ Neurochem. Res.