
Figure 6
- ID
- ZDB-IMAGE-210727-31
- Publication
- Pacheco et al., 2021 - Probiotic Bacteria with High Alpha-Gal Content Protect Zebrafish against Mycobacteriosis
- All Figures
- Figures for Pacheco et al., 2021
|
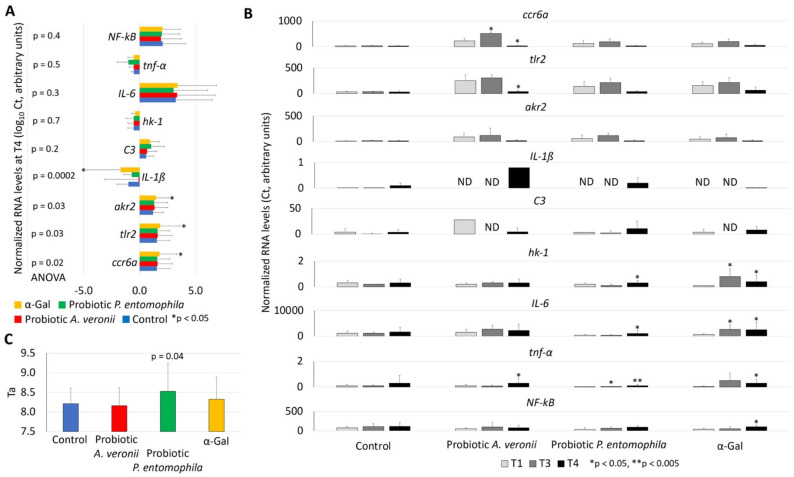
Figure 6 Expression of zebrafish immune-response genes in response to α-Gal and probiotic bacteria. The RT-qPCR was performed for the analysis of gene mRNA levels, using specific primers and conditions (Table 3). (A) The RNA normalized Ct values were compared between groups at T4 (end of the trial) by one-way ANOVA test followed by post hoc Holm multiple comparisons (https://astatsa.com/OneWay_Anova_with_TukeyHSD/; * p < 0.05, n = 3–20/group). (B) The RNA normalized Ct values were compared between T1 and T3/T4 by Student’s t-test with unequal variance (* p < 0.05, ** p < 0.005; n = 12–20/group). Abbreviation: ND, not detected. High-resolution graphs are shown in Supplementary Materials Figure S1. (C) Antioxidant capacity in serum (Ta) was determined by using the potassium permanganate method and Ta values were compared between treated and control groups at T4 by Student’s t-test with unequal variance (p < 0.05; n = 14–20/group). Data are shown as mean + SD.