
Figure 4
- ID
- ZDB-IMAGE-210727-29
- Publication
- Pacheco et al., 2021 - Probiotic Bacteria with High Alpha-Gal Content Protect Zebrafish against Mycobacteriosis
- All Figures
- Figures for Pacheco et al., 2021
|
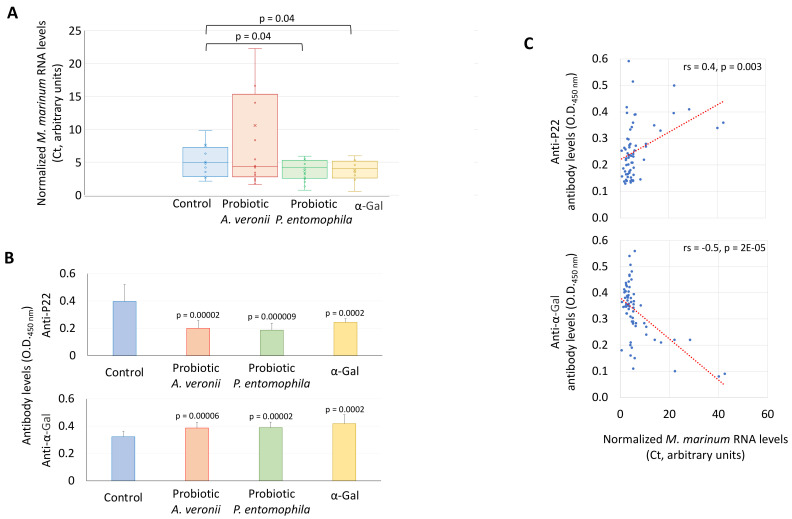
Figure 4 Effect of probiotic treatment and challenge with M. marinum on the zebrafish mycobacterial infection levels and antibody response. (A) Mycobacterium RNA levels were characterized by RT-qPCR in immunized and control PBS zebrafish challenged with M. marinum, normalized against D. rerio gapdh. The normalized Ct values were compared between treated and negative PBS control groups by Student’s t-test with unequal variance (p < 0.05; n = 10–17/group). (B) Anti-α-Gal and P22 IgM antibody titers were characterized by ELISA in immunized and control PBS zebrafish challenged with M. marinum. The o.d. at 450 nm (mean of the duplicate well values of o.d. P22 or α-Gal–o.d. PBS control plus standard deviation, SD) were compared between treated and negative PBS control groups at T4 by Student’s t-test with unequal variance (p < 0.005; n = 12–20/group). (C) Spearman’s Rho correlation analysis between antibody titers and M. marinum infection RNA levels (p < 0.005).