IMAGE

Fig 6

ID
ZDB-IMAGE-210725-78
Source
Figures for Qiu et al., 2021
Image
Figure Caption

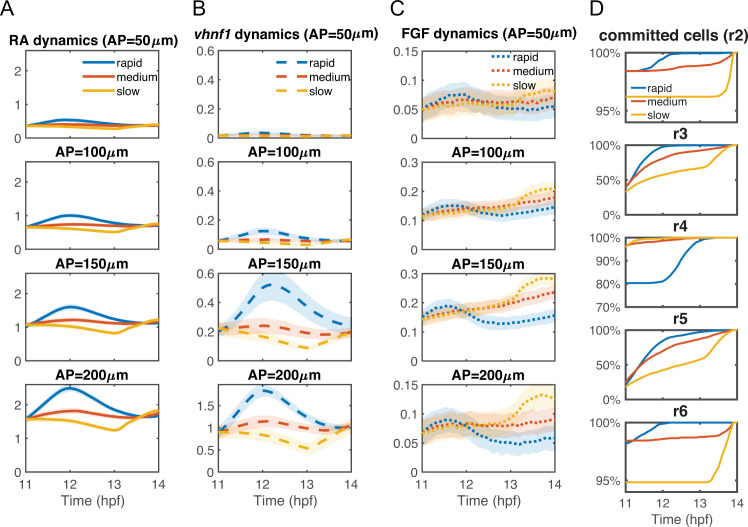
Fig 6 Dynamics of morphogens and cell commitment time with different convergence rates.

The statistics of the dynamics of (A) intracellular RA [RA]in, (B) vhnf1, and (C) FGF signaling [FGF]signal at different A-P lengths of the tissue domain: 50 μm, 100 μm, 150 μm and 200 μm. Lines represent average values and the width of the shading around each line represents the standard deviation. (D) The temporal dynamics of total percentages of cells that have committed in each rhombomere (r2-r6). Each panel shows the dynamics of the percentages of cells that have committed in each rhombomere. Data are collected from the full models, see Fig 4.

Acknowledgments
This image is the copyrighted work of the attributed author or publisher, and ZFIN has permission only to display this image to its users. Additional permissions should be obtained from the applicable author or publisher of the image. Full text @ PLoS Comput. Biol.