
Image
|
Figure Caption
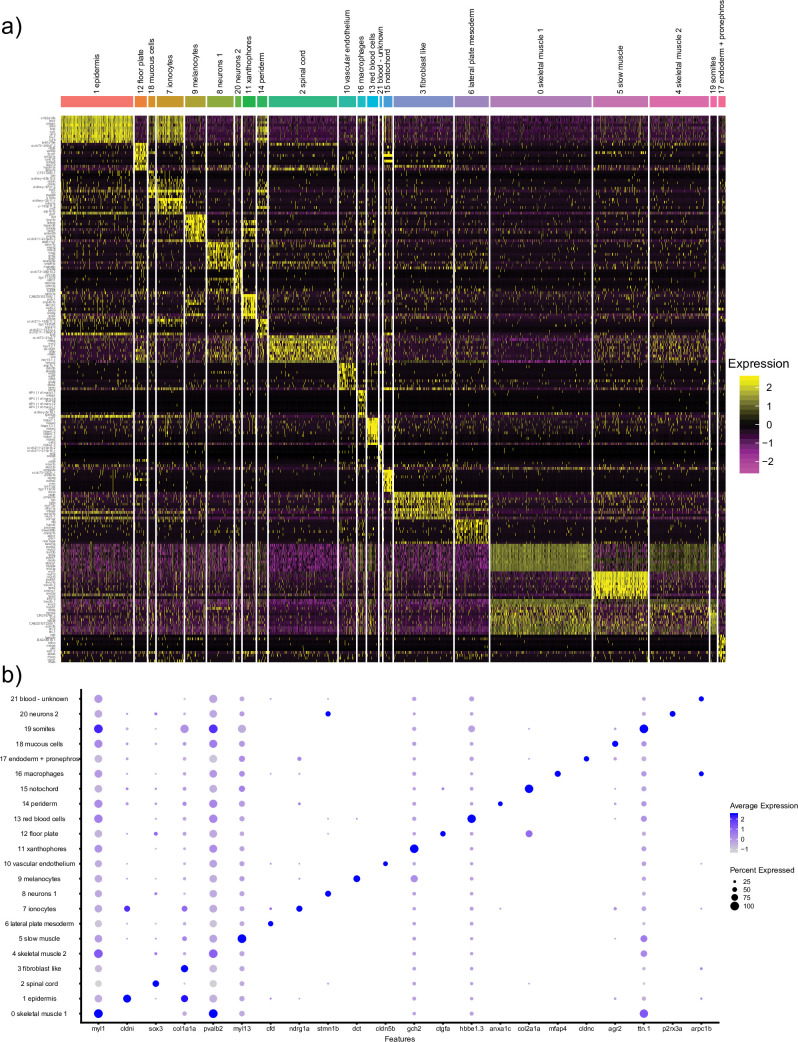
Fig 2 (a) A heatmap showing expression of marker genes expression in different clusters. (b) A dot plot showing the expression of selected genes in different clusters.
Acknowledgments
This image is the copyrighted work of the attributed author or publisher, and
ZFIN has permission only to display this image to its users.
Additional permissions should be obtained from the applicable author or publisher of the image.
Full text @ PLoS One