
|
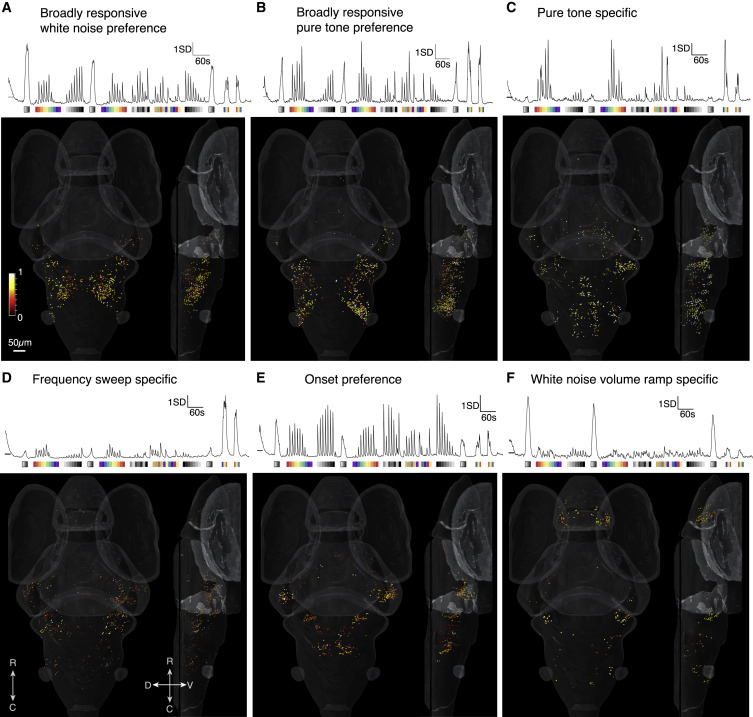
Fig. 2 K-means clustering revealed 6 clusters of ROIs that respond to particular properties of acoustic stimuli. (A and B) Two broadly tuned clusters were detected that were predominately located in the ON. (C) A pure-tone-specific cluster was present in the medial HB, lateral cerebellum, TS, and pretectum. (D) A third cluster, selective for pure tones, was detected with ROIs in the TS, ON, and lateral cerebellum. (E) An onset cluster was present in the TS, the lateral cerebellum, and the medial HB. (F) The final cluster revealed white noise volume ramp-selective ROIs located in the pallial region of the telencephalon, the lateral cerebellum, and sparsely in the HB. Scale bar applies to all panels. Response strengths and r2 values are represented as in Figure 1.