
|
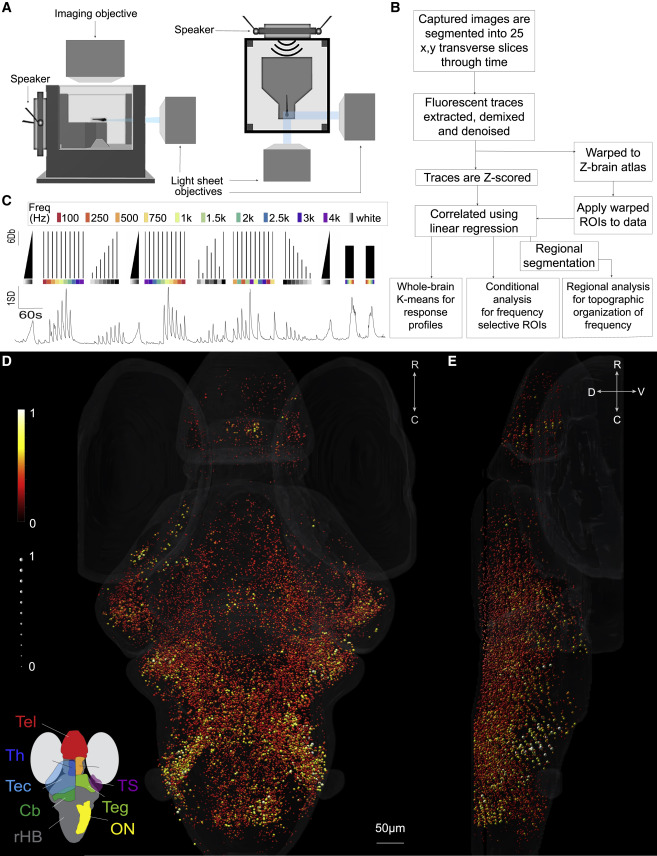
Fig. 1 (A) Schematic of the imaging and experimental setup used to observe brain activity from zebrafish larvae, showing the mini-speaker attached to the back coverslip of the chamber. (B) Summary of the analysis workflow used to identify and categorize auditory-responsive neurons across the brain. (C) Top: a schematic of the stimulus train used, including stimuli with a range of different forms, frequencies, and amplitudes. Bottom: the mean response of all the auditory-responsive ROIs in the resulting dataset is shown. (D and E) All auditory-responsive ROIs across the brain are shown with the strength of the response represented by the color and the correlation to the linear regression model (r2 value) represented as the size of the sphere. The strength of the response is between 2 (the threshold for inclusion) and 12 SD. Brain regions containing a high proportion of auditory-responsive ROIs are identified spatially (inset, D). Cb, cerebellum; HB, remaining hindbrain; ON, octavolateralis nucleus; Tec, tectum; Teg, tegmentum; Tel, telencephalon; Th, thalamus; TS, torus semicircularis. C, caudal; D, dorsal; R, rostral; V, ventral here and in subsequent figures. Scale bar applies to both (D) and (E). Particle motion and sound pressure recordings of the chamber can be found in Figure S1.