
Figure 6
- ID
- ZDB-IMAGE-210716-92
- Publication
- Lima Cunha et al., 2021 - REP1-deficiency causes systemic dysfunction of lipid metabolism and oxidative stress in choroideremia
- All Figures
- Figures for Lima Cunha et al., 2021
|
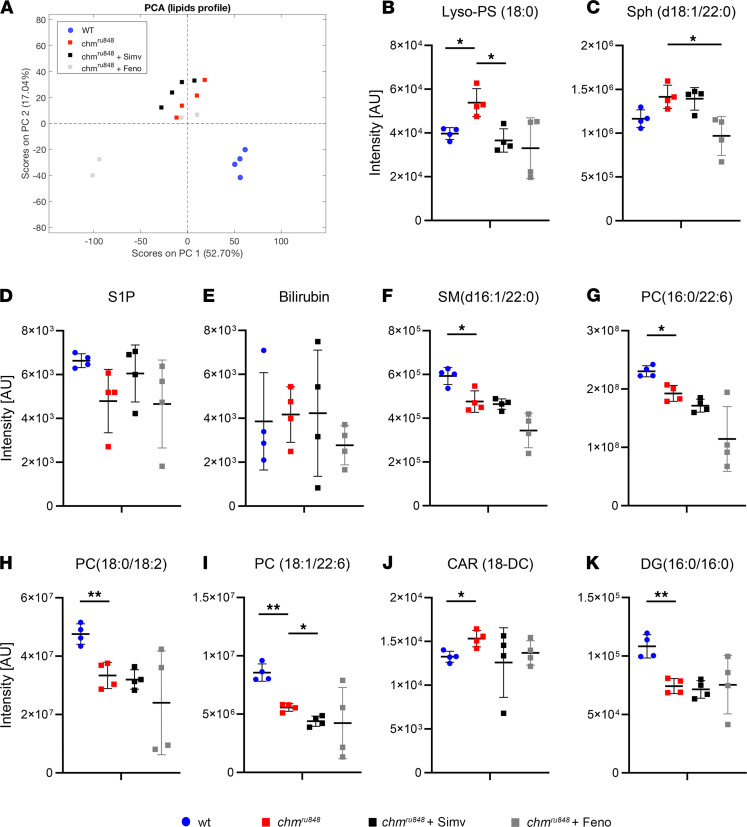
Figure 6 Lipidomic profiles of zebrafish. (A) PCA of day 6 chm ru848 mutant fish untreated (red squares) or treated with 0.3 nM simvastatin (black squares) or 700 nM fenofibrate (gray squares), compared with WT fish (blue circles). (B–K) Scatter dot plots with key metabolites shared with human plasma metabolites and respective levels detected in all groups. Lines indicate mean ± SD (n = 4, 10 fish per group). P value was determined using 1-way ANOVA. *P ≤ 0.05, **P ≤ 0.01. a.u., arbitrary units; Lyso-PS, lysophosphoserine/1-stearoyl-GPS; Sph(d18:1/22:0), lactosyl-N-behenoyl-sphingosine; S1P, sphingosine-1-phosphate; CAR, carnitine; PC, phosphatidylcholine; SM, sphingomyelin.