
IMAGE
Figure 5
- ID
- ZDB-IMAGE-210716-91
- Publication
- Lima Cunha et al., 2021 - REP1-deficiency causes systemic dysfunction of lipid metabolism and oxidative stress in choroideremia
- All Figures
- Figures for Lima Cunha et al., 2021
Image
|
Figure Caption
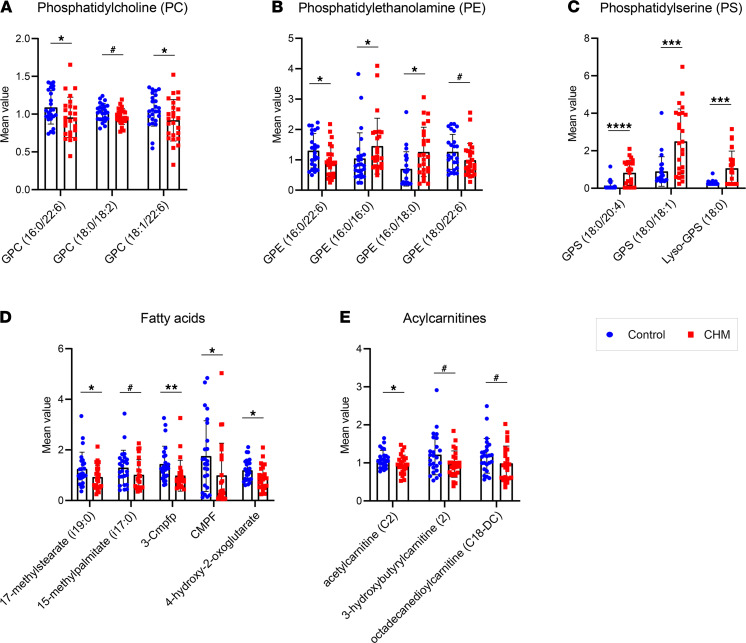
Figure 5 Metabolites involved in lipid metabolism subclasses differentially detected in CHM patients. (A–E) Bars represent mean ± SD of control (blue) and choroideremia (red) plasma samples (n = 25). P value was determined using matched pair t tests. *P ≤ 0.05, **P ≤ 0.01, ***P ≤ 0.001, ****P ≤ 0.0001. #0.05 < P ≤ 0.1. GPC, glycerophosphocholine; GPE, gylcerophosphoethanolamine; GPS, glycerophosphoserine; 3-Cmpfp, 3-carboxy-4-methyl-5-pentyl-2-furanpropionate; CMPF, 3-carboxy-4-methyl-5-propyl-2-furanpropanoate.
Acknowledgments
This image is the copyrighted work of the attributed author or publisher, and
ZFIN has permission only to display this image to its users.
Additional permissions should be obtained from the applicable author or publisher of the image.
Full text @ JCI Insight