
Figure 3
- ID
- ZDB-IMAGE-210716-89
- Publication
- Lima Cunha et al., 2021 - REP1-deficiency causes systemic dysfunction of lipid metabolism and oxidative stress in choroideremia
- All Figures
- Figures for Lima Cunha et al., 2021
|
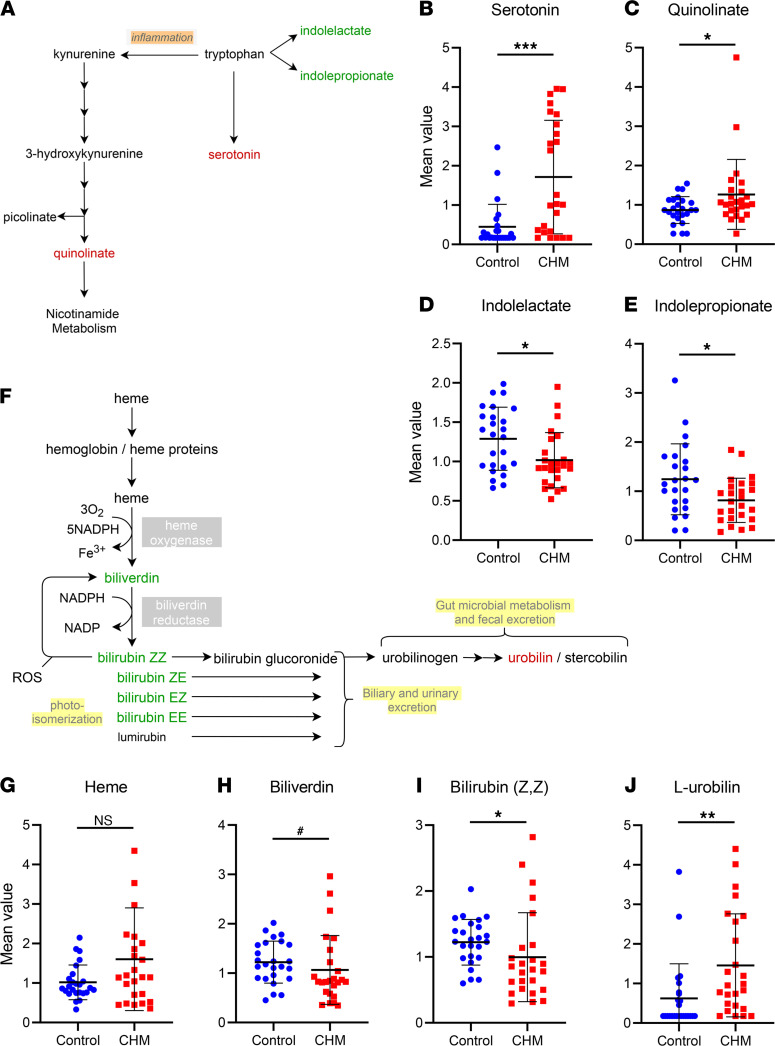
Figure 3 Alterations in tryptophan and hemoglobin metabolism pathways in CHM patients. (A) Pathway schematics and altered metabolites in tryptophan metabolism with decreased metabolites in green and increased in red. (B–E) Scatter dot plots of altered metabolites showing control (blue) and CHM (red) groups with mean ± SD (n = 25). (F) Schematic representation in the hemoglobin/heme metabolism pathway with decreased metabolites shown in green and increased metabolites in red. (G–J) Scatter dot plots of altered metabolites showing control (blue) and CHM (red) groups with mean ± SD (n = 25). P value was determined using matched pair t tests. #0.05 < P ≤ 0.1, *P ≤ 0.05, **P ≤ 0.01, ***P ≤ 0.001.