
Image
|
Figure Caption
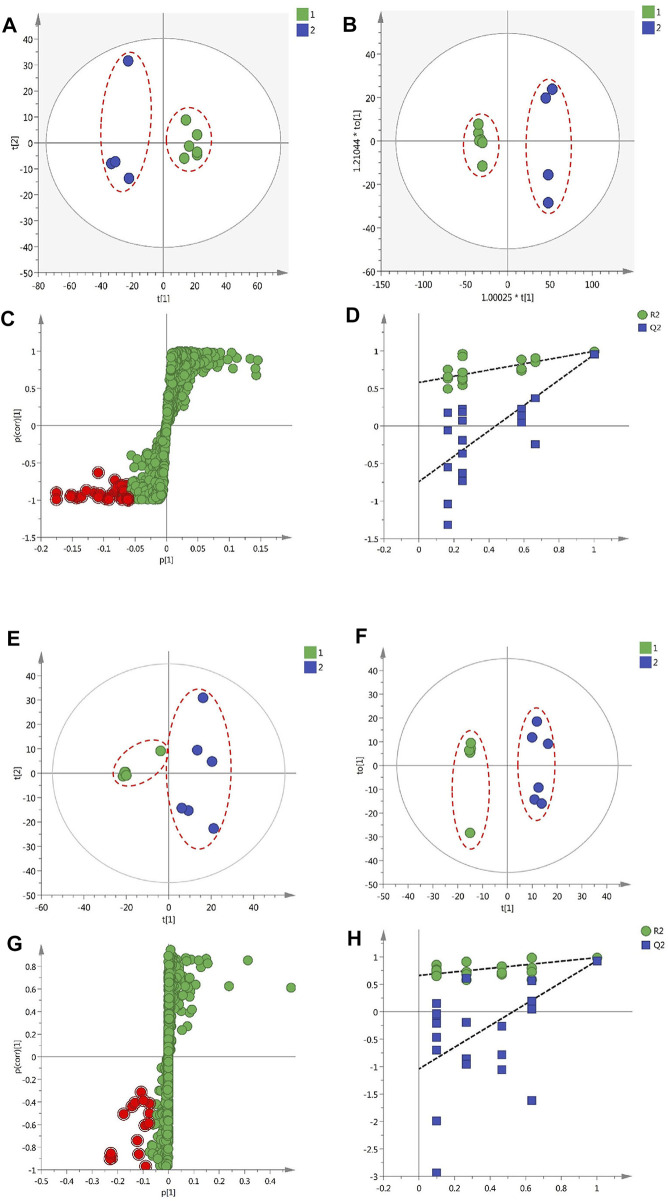
FIGURE 4 The results of multivariate statistical analysis of metabolomic data of protective effects of GF on liver injury and inflammation (A) A PCA scatter plot of 10 GF samples (B) The OPLA-DA scatter plot of the 10 samples (C) The S-plots for the OPLA-DA in the experiments of liver protection (D) PT test of the OPLA-DA model in experiments of liver protection (E) The PCA scatter plot of 11 GF samples (F) The OPLA-DA scatter plot of 11 samples (G) S-plots for the OPLA-DA in anti-inflammatory experiments (H) PT test of the OPLA-DA model in anti-inflammatory experiments.
Acknowledgments
This image is the copyrighted work of the attributed author or publisher, and
ZFIN has permission only to display this image to its users.
Additional permissions should be obtained from the applicable author or publisher of the image.
Full text @ Front Pharmacol