IMAGE

Figure 5

ID
ZDB-IMAGE-210716-24
Source
Figures for Su et al., 2021
Image
Figure Caption

Figure 5

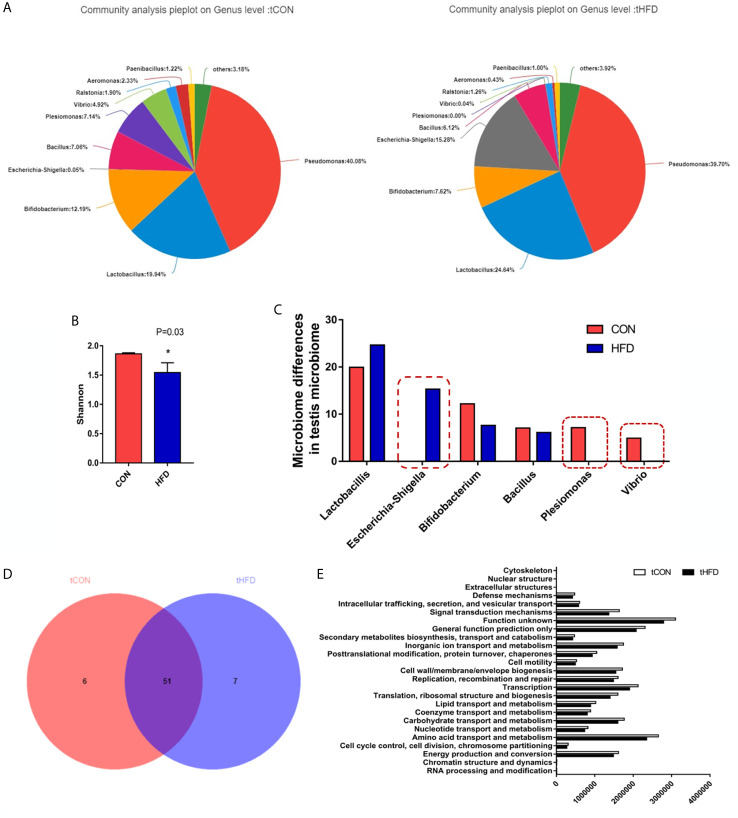
Microbial community composition analysis in the testes of normal and obese male zebrafish showing marked microbial differences between the two groups. (A) The pie chart shows the community species composition information of testicular microbes at the gate level in the control and HFD groups. (B) Shannon diagram of alpha diversity analysis of testicular microorganisms (P = 0.03). (C) Analysis and selection of dominant strains of testicular microbial communities that were markedly differently expressed in the two groups. (D) Venn plot population analysis results between the two groups. (E) Predictive analysis of microbiota function. Data represent mean ± SME (n = 3). * at P < 0.05.

Acknowledgments
This image is the copyrighted work of the attributed author or publisher, and ZFIN has permission only to display this image to its users. Additional permissions should be obtained from the applicable author or publisher of the image. Full text @ Front Immunol