
IMAGE
Figure 4
- ID
- ZDB-IMAGE-210716-23
- Publication
- Su et al., 2021 - Obesity Causes Abrupt Changes in the Testicular Microbiota and Sperm Motility of Zebrafish
- All Figures
- Figures for Su et al., 2021
Image
|
Figure Caption
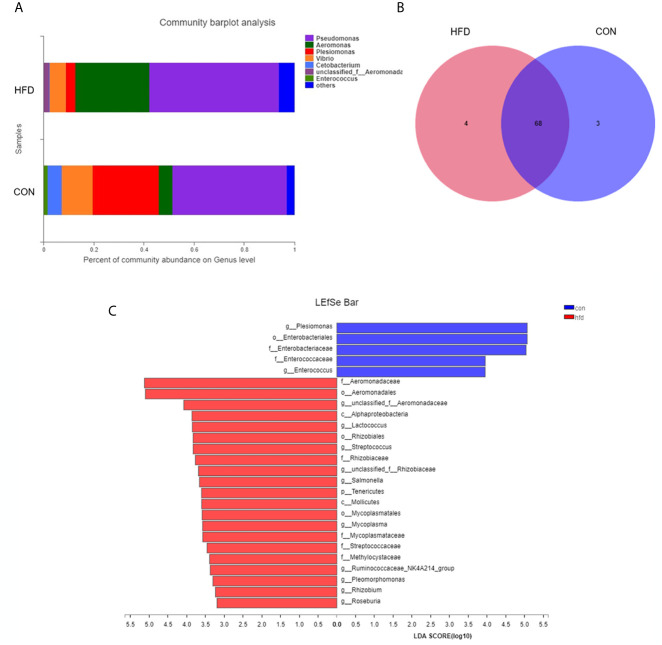
Figure 4
Differences in intestinal microbial composition after High-fat diet-induced obesity.
Acknowledgments
This image is the copyrighted work of the attributed author or publisher, and
ZFIN has permission only to display this image to its users.
Additional permissions should be obtained from the applicable author or publisher of the image.
Full text @ Front Immunol