IMAGE

Figure 1

ID
ZDB-IMAGE-210716-18
Source
Figures for Su et al., 2021
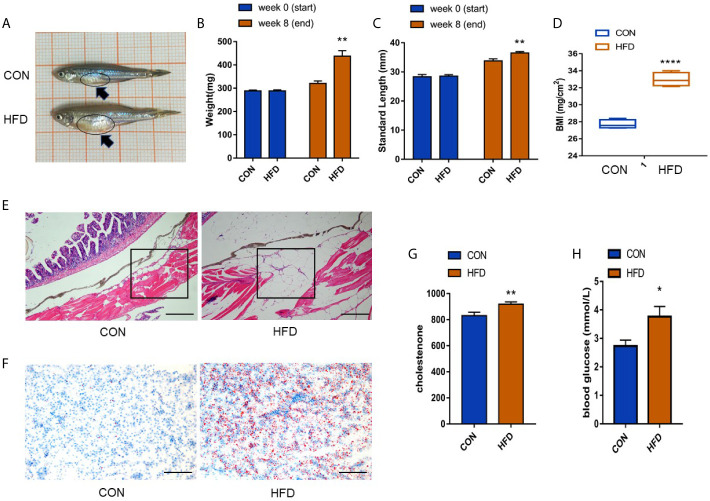
Image
Figure Caption

Figure 1

Successful establishment of the obesity model. (A) Male zebrafish appearance in control and obese groups. A clearly larger abdomen can be seen in zebrafish in the obese group as shown by the dark blue arrow. (B, C) Measurement of body weight and length of zebrafish before and after exposure. (D) Significant differences in the BMI index. (E) Expression of subcutaneous fat in zebrafish (scale bar = 100 μm). (F) Expression of fat droplets in the liver (scale bar = 100 μm). (G, H) Determination of cholesterol in the blood and detection of blood glucose. Values are mean ± SME (n = 5). The asterisk represents a statistically significant difference when compared with the controls; *, ** and **** at P < 0.05, P < 0.01 and P < 0.0001, respectively.

Acknowledgments
This image is the copyrighted work of the attributed author or publisher, and ZFIN has permission only to display this image to its users. Additional permissions should be obtained from the applicable author or publisher of the image. Full text @ Front Immunol