
Figure EV1
- ID
- ZDB-IMAGE-210714-41
- Publication
- Jamalpoor et al., 2021 - Cysteamine-bicalutamide combination therapy corrects proximal tubule phenotype in cystinosis
- All Figures
- Figures for Jamalpoor et al., 2021
|
Figure EV1
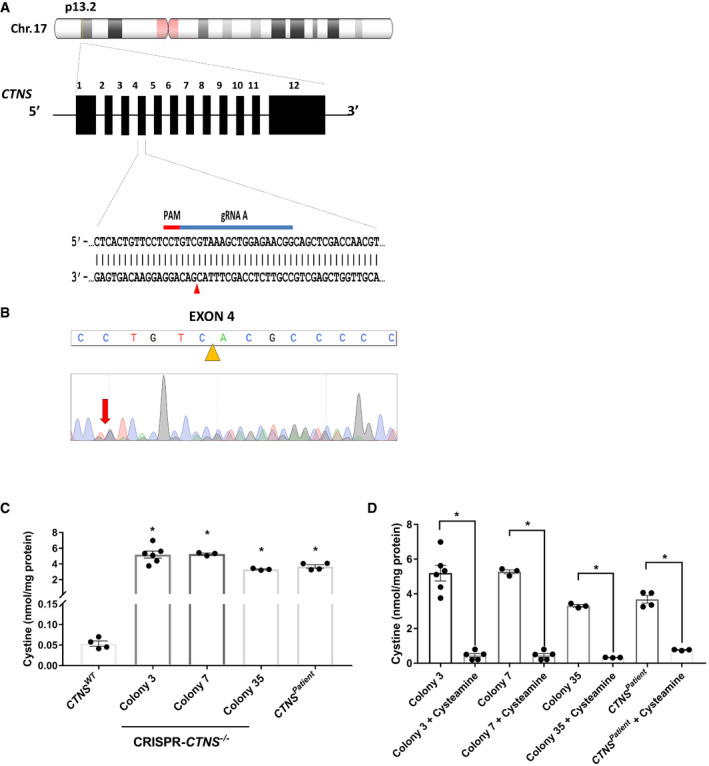
Schematic overview of the CRISPR‐based strategy to knockout the Sanger sequencing chromatogram shows resulting sequence in CRISPR‐generated cystinotic cells ( Quantification of cystine levels (nmol/mg protein) by HPLC‐MS/MS in control ( Quantification of cystine levels (nmol/mg protein) by HPLC‐MS/MS in
Data information: Data are expressed as mean ± SEM. *