
IMAGE
Fig. 6
- ID
- ZDB-IMAGE-210712-25
- Publication
- Buono et al., 2021 - Analysis of gene network bifurcation during optic cup morphogenesis in zebrafish
- All Figures
- Figures for Buono et al., 2021
Image
|
Figure Caption
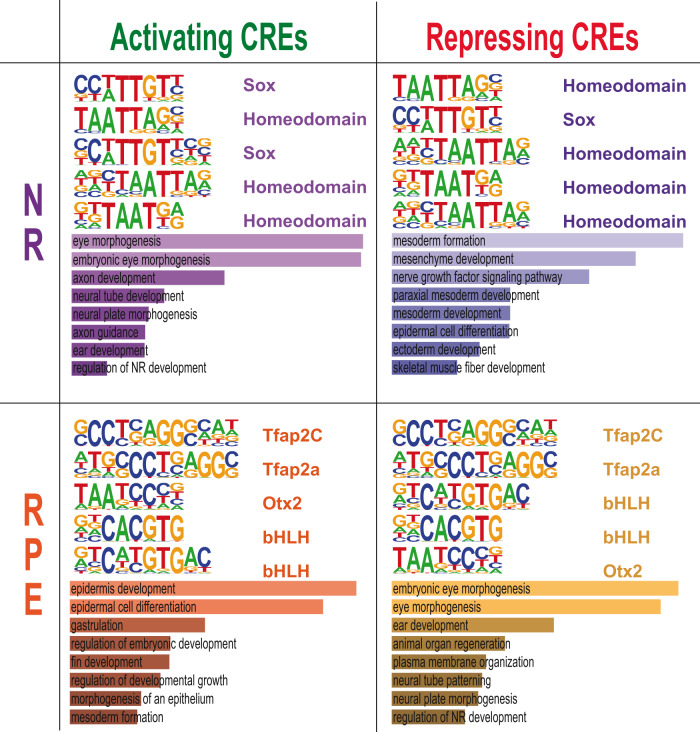
Fig. 6
Representative TF motifs enriched in activating (left column) and repressing (right column) CREs in both the NR and RPE domains. Analysis of GO terms enrichment for genes associated with each set of elements is indicated.
Acknowledgments
This image is the copyrighted work of the attributed author or publisher, and
ZFIN has permission only to display this image to its users.
Additional permissions should be obtained from the applicable author or publisher of the image.
Full text @ Nat. Commun.