
Figure 6
- ID
- ZDB-IMAGE-210711-3
- Publication
- Wang et al., 2021 - BMP and Notch Signaling Pathways differentially regulate Cardiomyocyte Proliferation during Ventricle Regeneration
- All Figures
- Figures for Wang et al., 2021
|
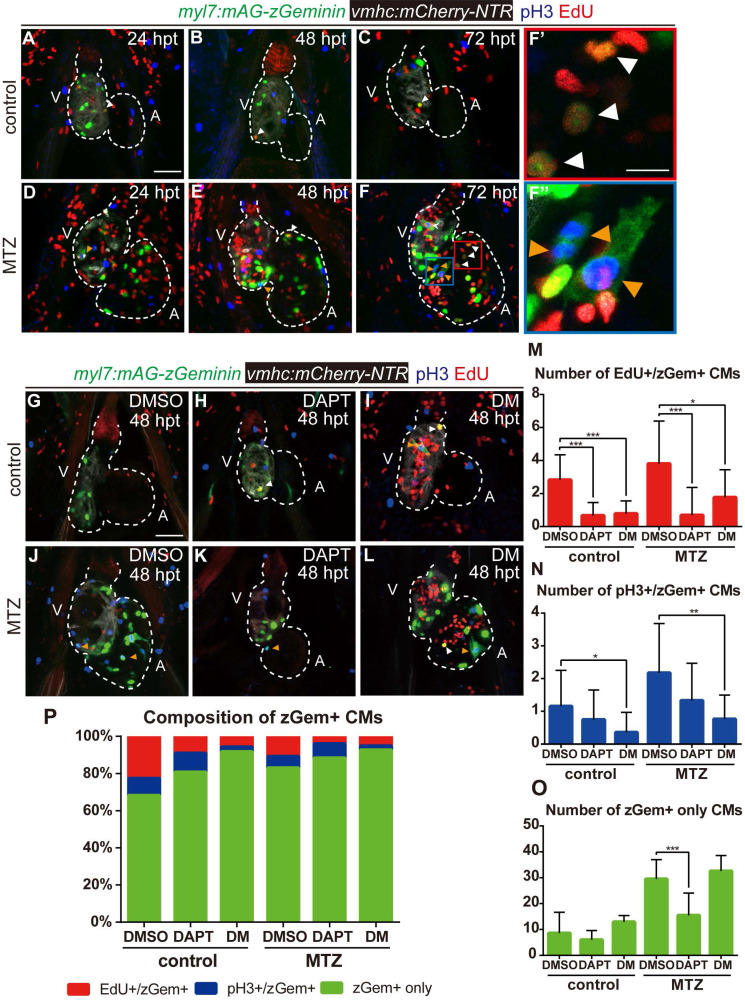
Figure 6 BMP and Notch signaling pathways differentially influence cardiomyocyte cell-cycle progression. (A-F'') Confocal stack projections of Tg(vmhc:mCherry-NTR; myl7:mAG-zGeminin) hearts with immunofluorescence of phospho-histone H3 and EdU showed proliferating CMs in different phases of cell cycle in control or ablated groups at 24, 48 and 72 hpt. (F', F”) magnified red and blue box areas in F. White arrowheads point to EdU+/ zGem+ CMs, orange arrowheads point to pH3+/ zGem+ CMs. (G-L) Confocal stack projections of Tg(vmhc:mCherry-NTR; myl7:mAG-zGeminin) hearts with immunofluorescence of phospho-histone H3 and EdU in control or ablated groups without or with DAPT or DM treatment at 48 hpt. White arrowheads point to EdU+/ zGem+ CMs, orange arrowheads point to pH3+/ zGem+ CMs. (M-P) Quantification of EdU+/zGem+ (M), pH3+/zGem+ (N), and zGem+ only (O) CM number in control or ablated groups without or with DAPT or DM treatment at 48 hpt. The respective proportions in total zGem+ CMs were shown in P. Mean + SD, N=12-18 for each group, Student's t-test, *, P < 0.05, **, P < 0.01, ***, P < 0.001. Scale bars, (A-L) 50 µm, (F', F”) 20 µm. hpt, hours post MTZ-treatment; A, atrium; V, ventricle; CM, cardiomyocyte; DM, dorsomorphin. Dashed lines outline the hearts.