
Figure 4
- ID
- ZDB-IMAGE-210711-13
- Publication
- Wang et al., 2021 - BMP and Notch Signaling Pathways differentially regulate Cardiomyocyte Proliferation during Ventricle Regeneration
- All Figures
- Figures for Wang et al., 2021
|
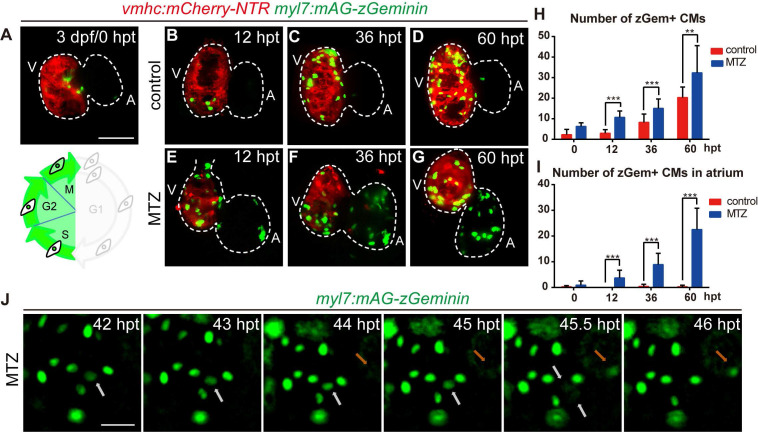
Figure 4 FUCCI as a cardiomyocyte proliferation indicator during ventricle regeneration. (A-G) Confocal stack projections of Tg(vmhc:mCherry-NTR; myl7:mAG-zGeminin) hearts showed pattern of zGem+ CMs at 3 dpf/0 hpt, which are in the S, G2 and M phases of the cell-cycle (A). Numbers of zGem+ CMs dramatically increased in the atrium of ablated hearts (E-G) compared to control hearts (B-D). (H, I) Quantification of zGem+ CM numbers in the whole heart (H) or in the atrium only (I) of control and ablated groups at 0, 12, 36 and 60 hpt. Mean + SD, N=8-15 for each time point, Student's t-test, **, P <0.01, ***, P < 0.001. (J) Time-lapse images of Tg(myl7:mAG-zGeminin) hearts showed the dynamic pattern of zGem+ CMs during 42-46 hpt. White arrows point to a CM which lost zGem+ signal after division, while orange arrows point to a CM with newly appeared zGem+ signal. Scale bars, (A-G) 50 µm, (J) 20 µm. dpf, days post fertilization; hpt, hours post MTZ treatment; A, atrium; V, ventricle; CM, cardiomyocyte. Dashed lines outline the hearts.