
|
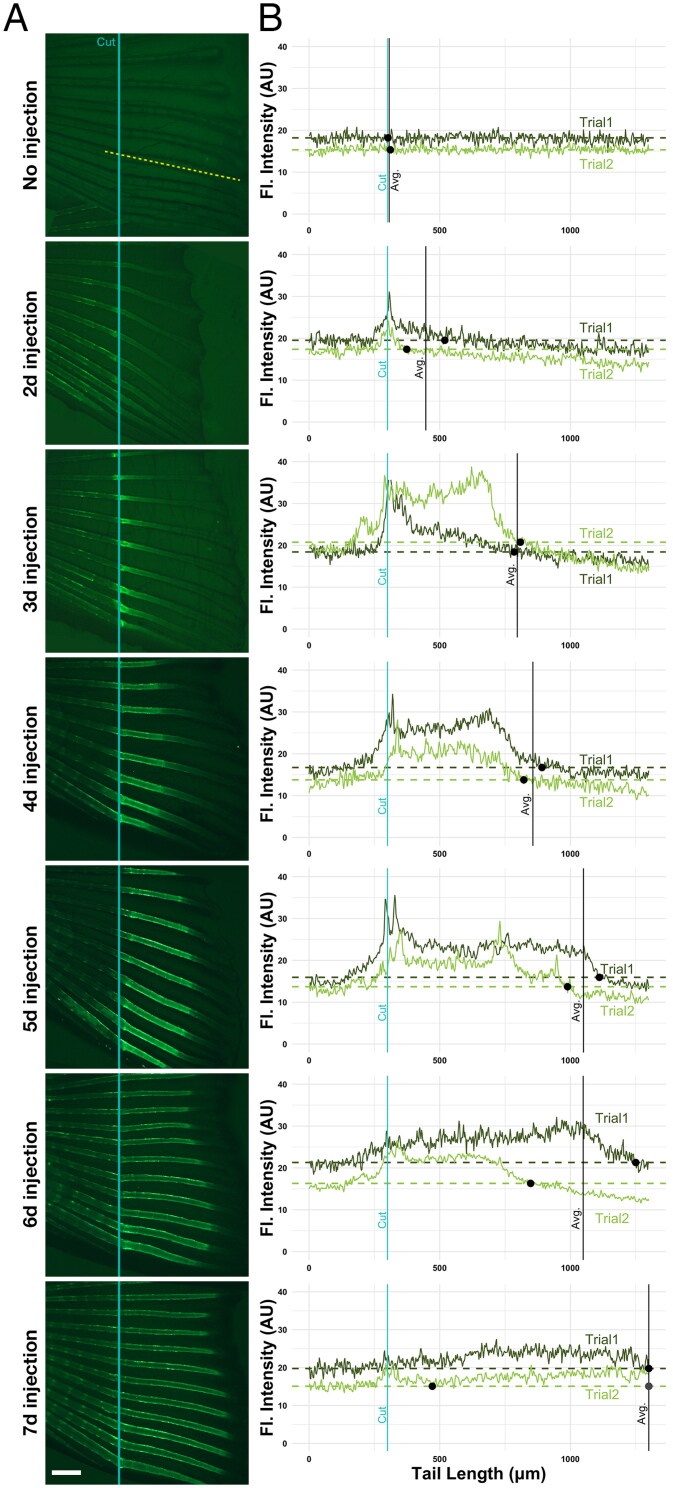
Figure 3.
C-dots distribute evenly throughout available regenerating bones. (A) C-dots deposit on available regenerating bone at time of injection. Injection days after amputation are indicated on the left. Specimens were imaged 8 days after amputation, anterior to the left. Site of the cut is indicated with a blue line, and the site of the profile intensity analysis with a yellow dashed line. Experiments were done in duplicate, with three fish per trial. Scale bar is 500 µm. (B) Fluorescent intensity quantification profile across the length of the fourth ventral fin ray (bone), in two representative fish from two independent experiments. Fluorescent signal in arbitrary units (A. U.) was normalized to saline-injected controls. Blue line indicates the site of amputation, black dots indicate the position where fluorescence in regenerating bone reaches average background fluorescence levels (non-regenerated portion of the bone; dashed line), and black line indicates the position where average fluorescence levels in both specimens reach background levels (except in 7-day fish, were average for trial 2 fish reaches background levels twice; gray dot).