
|
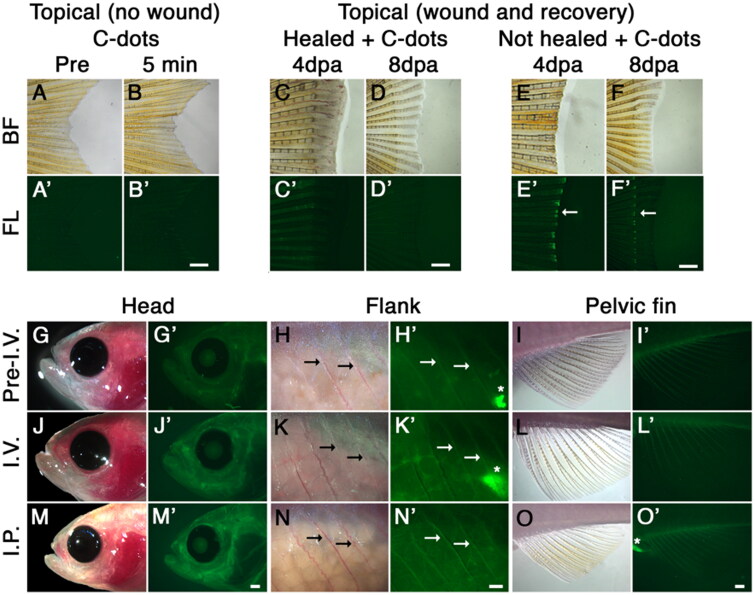
Figure 1.
C-dots binding to adult ossified tissue. (A, B) Bright field (BF; A, B) and fluorescent (FL; A’, B’) images of caudal fins before (A, A’) and 5 min after (B, B’) cutaneous exposure of C-dots to skin (2 min; 2 µg/ml). (C, D) Similar to B, cutaneous exposure of C-dots to a healed wound 4 and 8 days post amputation (dpa) does not label local bones. (E, F) Cutaneous exposure of caudal fins to C-dots immediately after amputation resulted in bone labeling at the wound site (E, E’; green fluorescence; white arrow). Four days later, C-dots can be observed in bone tissue at the wound site, but not in new bone tissue (F, F’). (G–I) Images of head, flank and pelvic fin of fish prior to intravascular injection (Pre-I.V.) of C-dots under reflected bright field and epi-fluorescent illumination. Thick tissues naturally display a low level of background fluorescence. (J–L) Intravascular injection (I.V.) of C-dots resulted in fluorescent labeling of ossified tissue 1 h after injection. (M–O) Intraperitoneal injection (I.P.) of C-dots also resulted in fluorescent labeling of bones 1 h after injection.