
|
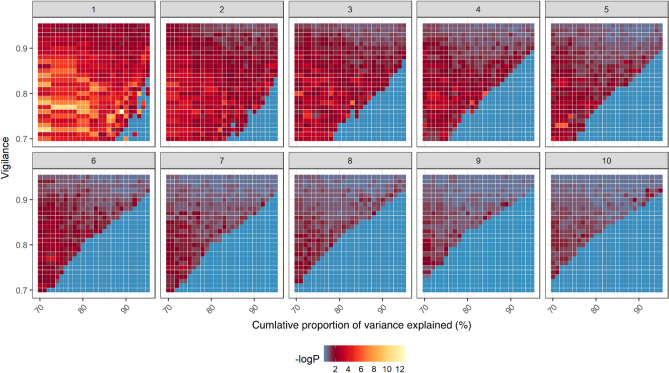
Figure 4 Clustering showed that a higher –log10 (p)) value will lead to ES-specific behavior. For the different time segment behaviors (1 ~ 10 s, figure panel label), the correlation between the cluster and treatment was shown in each tile under different clustering analysis conditions. A binomial test was performed to examine whether the behavior feature was significantly biased toward the treatment (ES). The legend is shown below the heatmap, with the minimal -log10 (p) of the binomial test of the top ES-specific behavior feature on that clustering analysis condition shown in dark blue and high –log10(p) shown in yellow.