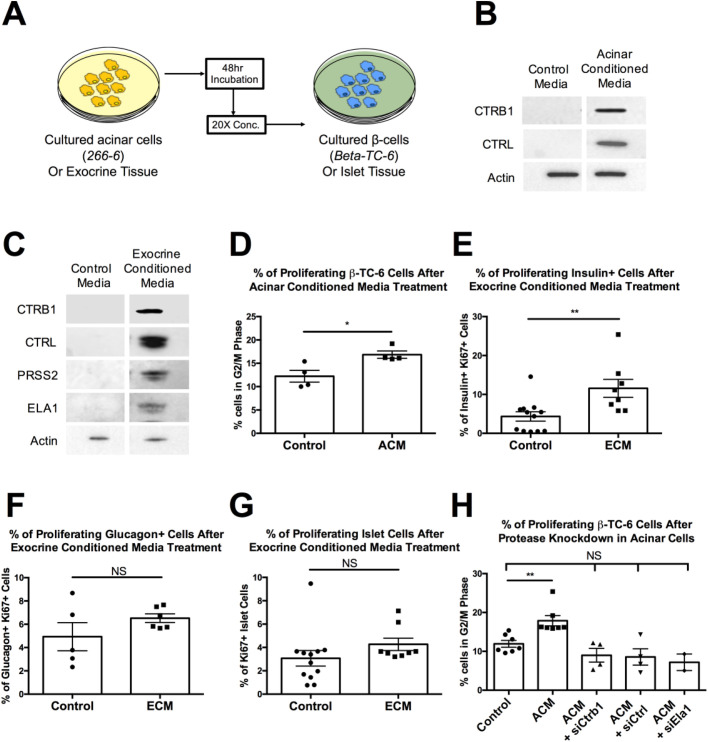
Fig. 3. (A) Schematic of experimental design for assessing protease-β-cell interaction in cultured β-cells and islets. (B) Western blot of β-TC-6 lysate from cells treated with control media or acinar conditioned media (ACM) using anti-CTRB1 and anti-CTRL antibodies. (C) Western blot of islet tissue lysate from islets treated with control media or exocrine conditioned media (ECM) using anti-CTRB1, anti-CTRL, anti-PRSS2 and anti-ELA1 antibodies. (D) Quantification of proliferating β-TC-6 cells by percentage of cells in G2/M phase in control media or ACM treated cells. (E) Quantification of proliferating β-cells (insulin+) by percentage of Ki67 positive cells in control media or ECM treated islets. (F) Quantification of proliferating α-cells (glucagon+) by percentage of Ki67 positive cells in control media or ECM treated islets. (G) Quantification of proliferating islet cells by percentage of Ki67 positive cells in control media or ECM treated islets. (H) Quantification of proliferating β-TC-6 cells by percentage of cells in G2/M phase in control media, ACM, ACM lacking CTRB1 (ACM+siCtrb1), ACM lacking CTRL (ACM+siCtrl) and ACM lacking ELA1 (ACM+siEla1) treated cells. (**=P<0.01, Ordinary one-way ANOVA). Error bars represent standard error of the mean, symbols represent the following significance: NS=P>0.05, *=P<0.05, **=P<0.01, ***=P<0.001, Student's t-test unless otherwise indicated.
Image
Figure Caption
Acknowledgments
This image is the copyrighted work of the attributed author or publisher, and
ZFIN has permission only to display this image to its users.
Additional permissions should be obtained from the applicable author or publisher of the image.
Full text @ Biol. Open

