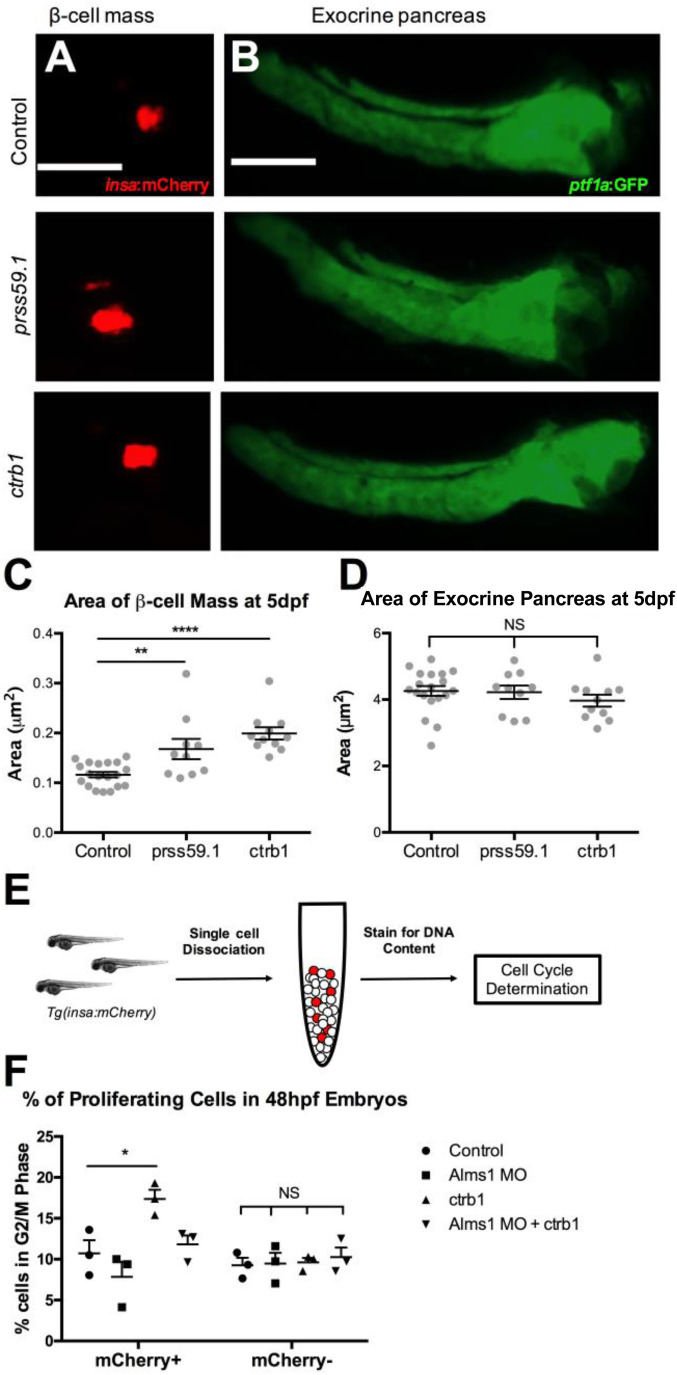
Protease overexpression specifically increases β-cells by induction of proliferation. (A) insa:mCherry expression at 5 dpf representing total area of the β-cell mass in control, prss59.1 mRNA, and ctrb1 mRNA injected animals. Scale bar: 100 μm. (B) ptf1a:GFP expression at 5 dpf representing total area of the exocrine pancreas in control, prss59.1 mRNA, and ctrb1 mRNA injected animals. Scale bar: 100 μm. (C) Quantification of area of mCherry fluorescence of β-cell mass in control (n=19), prss59.1 mRNA (n=10), and ctrb1 mRNA (n=11) injected animals at 5 dpf. (D) Quantification of area of GFP fluorescence of exocrine pancreas in control (n=19), prss59.1 mRNA (n=10), and ctrb1 mRNA (n=11) injected animals at 5 dpf. (E) Schematic of experimental design for cell cycle determination of β-cells in zebrafish embryos at 48 hpf. (F) Quantification of proliferating β-cells (mCherry+) and non-β-cells (mCherry−) by percentage of cells in G2/M phase in control, alms1 MO, ctrb1 mRNA, and alms1 MO plus ctrb1 mRNA injected animals at 48 hpf (n=3 experiments; each experiment represents n=50 embryos). All statistics, Ordinary one-way ANOVA, error bars represent standard error of the mean, symbols represent the following significance: NS=P>0.05, *=P<0.05, **=P<0.01, ****=P<0.0001.
Acknowledgments
This image is the copyrighted work of the attributed author or publisher, and
ZFIN has permission only to display this image to its users.
Additional permissions should be obtained from the applicable author or publisher of the image.
Full text @ Biol. Open
Your Input Welcome
Thank you for submitting comments. Your input has been emailed to ZFIN curators who may contact you if
additional information is required.
Oops. Something went wrong. Please try again later.