
|
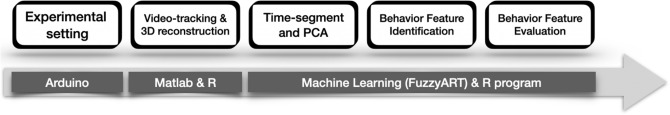
Figure 1
Flowchart illustrating the experimental strategy of this study. The experimental workflow included recorded novel tank test behaviors across treatments and trials. A video-tracking analysis was performed and 3D swimming path reconstruction was performed by using customized MATLAB and R software. Time-segmentation and dimensionality reduction of the 3D spatiotemporal data were performed by a principal component analysis (PCA), followed by unsupervised clustering by using customized machine learning algorithms (FuzzyART) across all behavioral spatiotemporal data to identify potential behavior features linked to treatment. Finally, a behavior feature evaluation was performed with the trained model and new input data.