
Image
|
Figure Caption
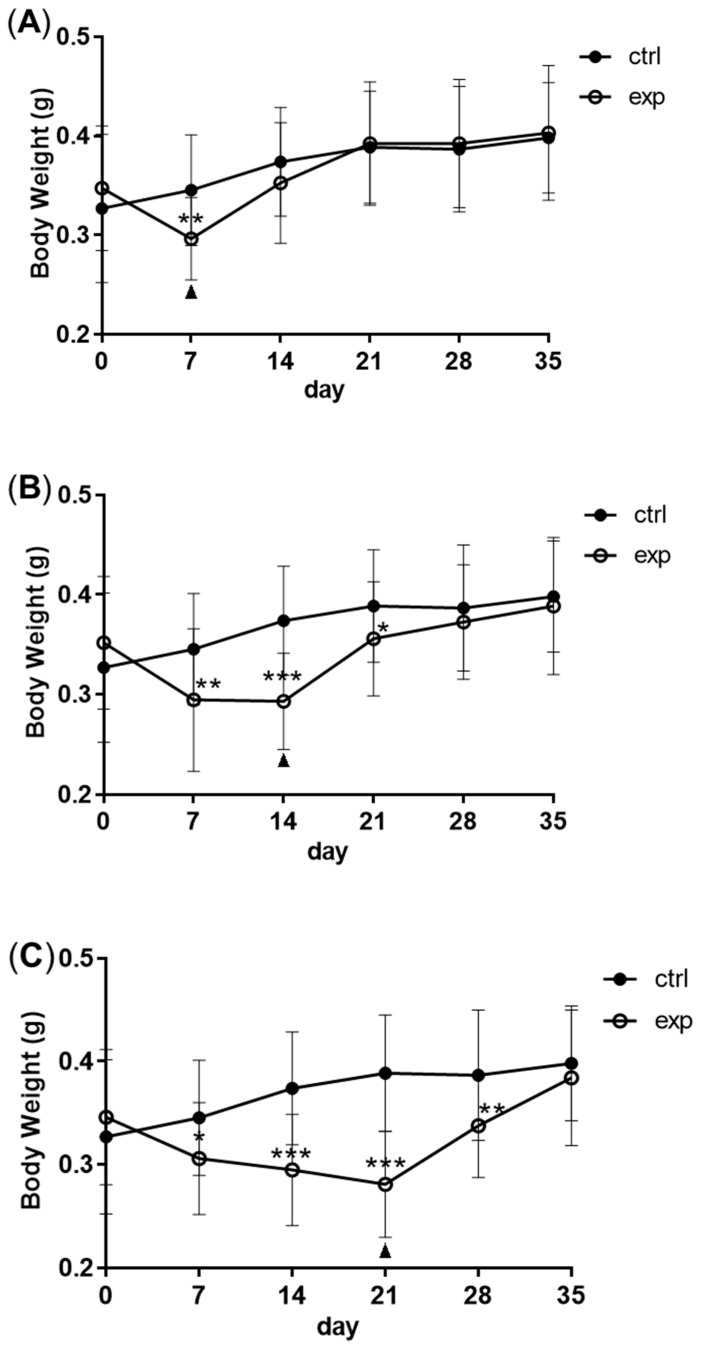
Figure 1 The model of compensatory growth in zebrafish. A to C: the body weight change of zebrafish during fasting and refeeding. (A) The zebrafish were fasted for 7 days and refed for 28 days. (B) The zebrafish were fasted for 14 days and refed for 21 days. (C) The zebrafish were fasted for 21 days and refed for 14 days. n = 21–22. (D) The survival rate of zebrafish which were intraperitoneally injected with S. agalactiae; F: feeding; S: starvation; R: refeeding. n = 3, *: p < 0.05, **: p < 0.01; ***: p < 0.001.
Acknowledgments
This image is the copyrighted work of the attributed author or publisher, and
ZFIN has permission only to display this image to its users.
Additional permissions should be obtained from the applicable author or publisher of the image.
Full text @ Biomolecules